This is the first in a series of articles on new technology for bowlers and others in the bowling industry. There is an old Chinese curse, “May you live in interesting times”. For bowlers these are definitely interesting times. Never before have there been so many options for equipment. Bowling ball manufacturers are each touting their own scientifically designed weight blocks and coverstocks. Mid and high performance balls ship with suggested drilling layouts.
“The most important thing in science is not so much to obtain new facts as to discover new ways of thinking about them.”
-Sir William Bragg
With all of the new balls available on the market each month, it can be daunting to decide which ball, drilling layout, and surface would be best for you. Having access to an experienced, professional ball driller who knows your game is invaluable, but with all the choices available, there are likely to be lots of good options. How do you zero in on your best option? Often, when existing technology creates problems, a solution arises through the application of new technology.
Case in point, Powerhouse has introduced Blueprint to help pro shop operators, coaches, and bowlers take advantage of the latest bowling equipment. From the Blueprint website:
“Blueprint gives you a customized look at how YOUR ball will perform on the lane. Use the software to pick the best equipment for you, and to better understand your game. With Blueprint’s 3D modeling technology, you can visualize the drilling process. Try out different drilling layouts. Experiment with weight holes and see how the mass properties are affected. You no longer have to guess when it comes to drilling. Blueprint uses a physics-based dynamics solver to simulate the performance of a bowling ball. It takes into account the actual ball geometry and mass properties, the oil pattern and lane surface, and your unique delivery. See how different drilling layouts will affect your shot, or use the simulator to find the best line of play on a particular oil pattern.”
That’s quite a bit to take in all at once. Let’s take Blueprint for a test drive and see how it works. Installation and licensing of the Blueprint software is straightforward and well documented on the Powerhouse site at http://powerhousebowling.com/blueprint/downloads. If you have questions about Blueprint or difficulty with the installation, you can get email support via the Blueprint website or call Powerhouse directly at 800-626-8350. A free five-day trial version is available at http://blueprintbowling.com/freetrial.aspx and was used to create the screenshots in this article.
Let’s go for a drive
Once you start the Blueprint software you will see the Home screen shown in Figure 1. This screen provides the directions for using the software and easy navigation to the other screens.
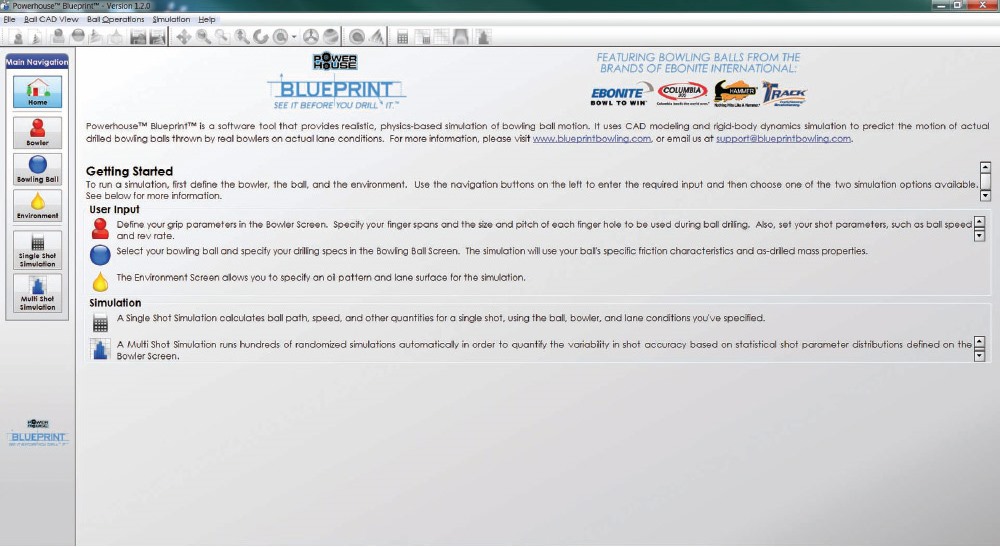
Figure 1. Blueprint Software Home Screen
Selecting the Bowler icon on the left brings up the Bowler Information Grip Parameters and Delivery Parameters screen shown in Figure 2. The bowler’s first and last name and which hand they bowl with goes into the Bowler Information window. Additional notes or comments can also be entered.
On the right of the screen you’ll see the Grip Parameters tab active by default. This is where you would enter the span, pitch, and the size and depth of the finger and thumbholes. The bridge width and location of the PAP are also required. Numerical values can be entered either as fractions such as 25/32 or as decimals such as 3.25. There is a section in the Help documentation that shows typical values for the grip parameters.
Once the grip information has been entered, continue to the Bowler Delivery Parameters screen by clicking on the Delivery Parameters tab which is shown in Figure 3.
The Bowler Delivery Parameters include the default line to play, ball speed at foul line, rev rate in RPM, axis rotation angle, axis tilt angle, and loft distance. Those familiar with CATS will recognize these key parameters. (Speed indicators at bowling centers determine ball speed at the far end of the lane, so the ball speed at the foul line will be 1.5 to 2.5 mph faster).
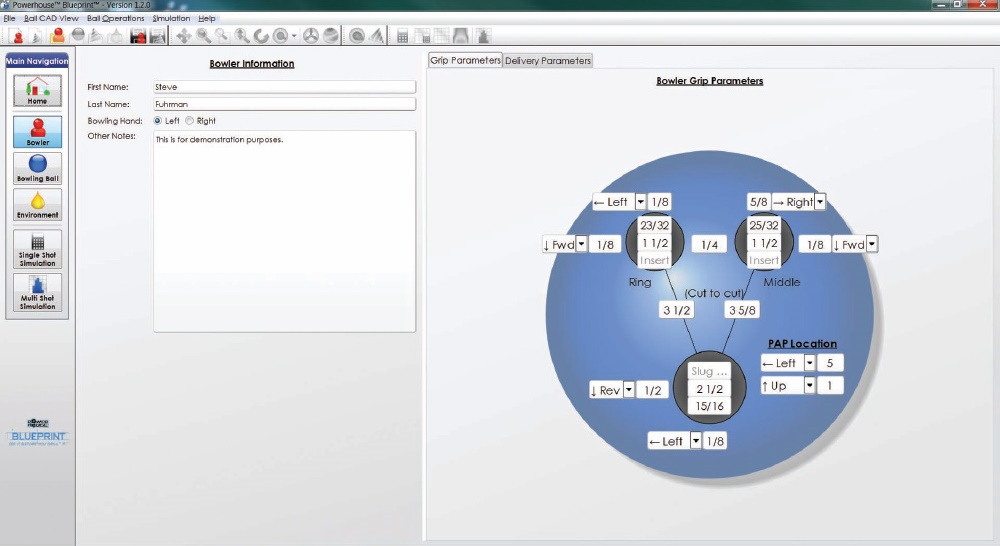
Figure 2. Bowler Grip Parameters
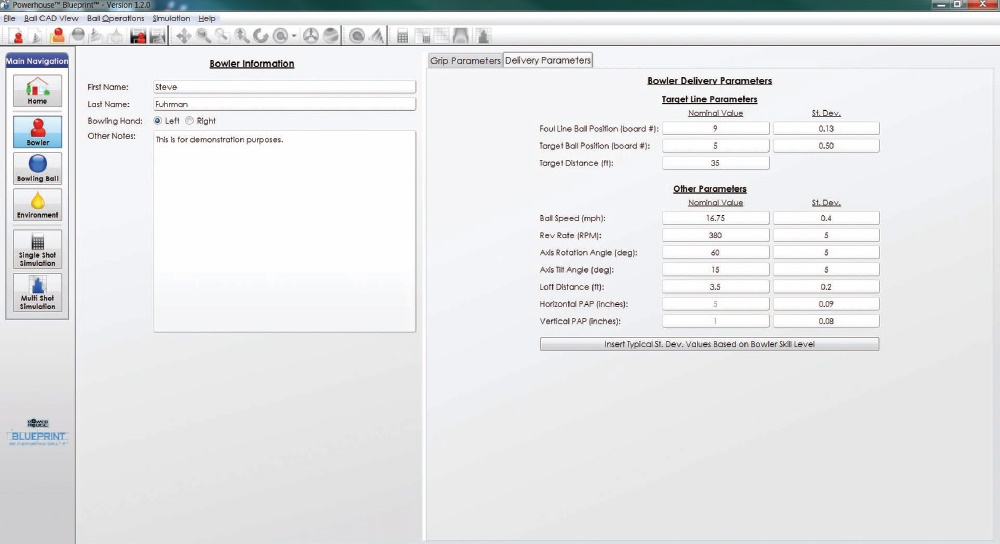
Figure 3. Bowler Delivery Parameters
An additional column on the delivery parameters is titled St Dev, which is an abbreviation for Standard Deviation. A Standard Deviation defines the shape of a “bell curve”. The smaller the standard deviation, the tighter and taller the bell curve. Statistically, 68 percent of all the data lies within one standard deviation of the mean and 95 percent within two standard deviations. What this means in this context is the smaller the standard deviations in the parameters, the more consistency will be seen shot to shot. These values will be used extensively in the Multi Shot Simulation screen.
Since gathering accurate standard deviations is a time-consuming and painstaking process, as a convenience, Blueprint provides predefined sets of values based upon average range and includes one for professional bowlers as well. For the most accurate results, you would use your specific values determined by a CATS session or video sessions with an experienced coach. For the purposes of this evaluation, one of the predefined sets will be sufficient.
These predefined values can be entered by clicking on the “Insert Typical St Dev based on Bowler Skill Level” button. This brings up the dialog shown in Figure 4.
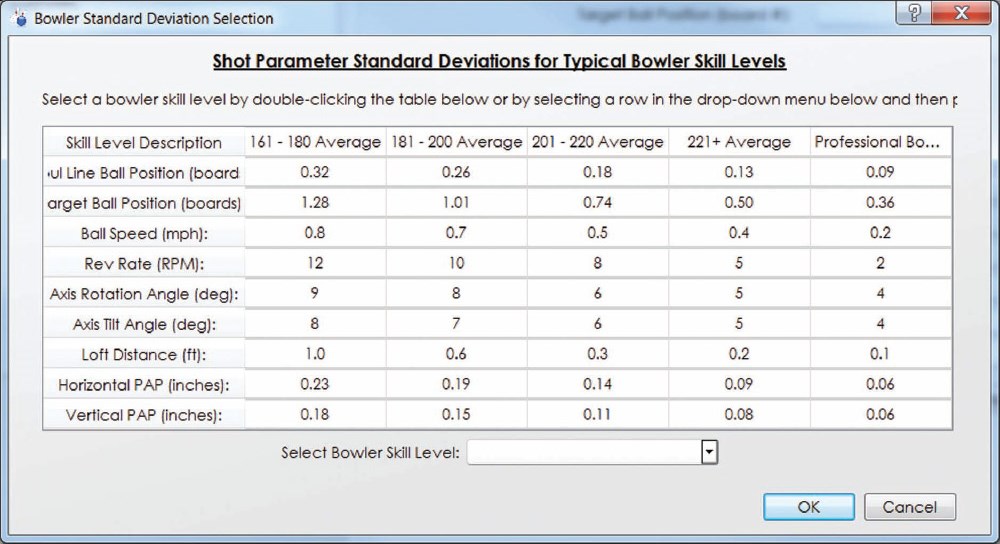
Figure 4. Shot Parameter Standard Deviations for Typical Bowler Skill Levels
Select the Bowler Skill Level from the drop-down list and click OK to populate the values into the Bowler Delivery Parameters. The next step is to select a ball and to virtually drill it. The Bowling Ball screen is shown in Figure 5. Virtual Drilling has been successfully completed.
The trial version of Blueprint includes CAD information for five bowling balls. Rich Hanson, brand manager for Blueprint at Powerhouse, said that the retail version currently ships with 40+ balls and that new balls would be added each year. Currently the plan is to only support balls in the Ebonite International family like Ebonite, Columbia 300, Hammer, and Track.
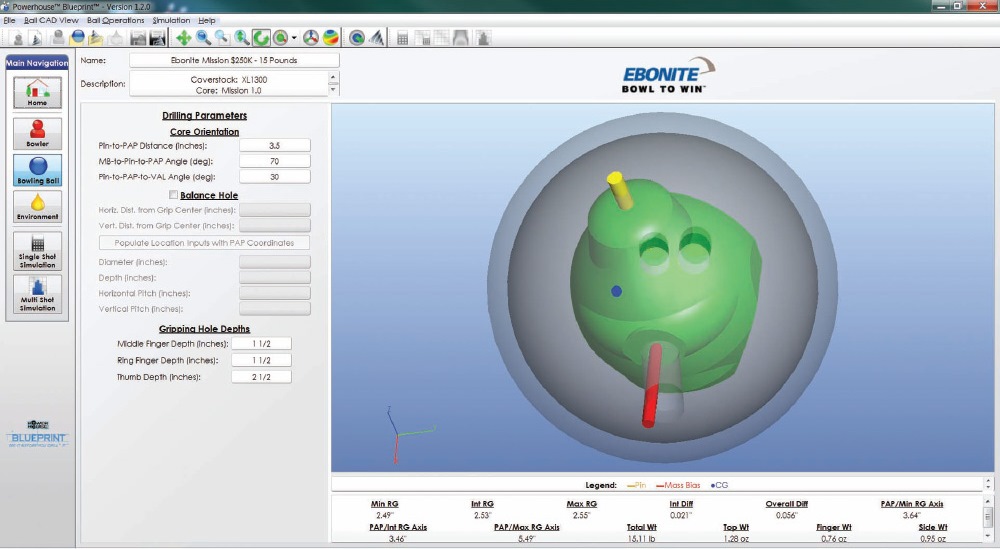
Figure 5. Bowling Ball Selection and Virtual Drilling
Here, a 15 pound Ebonite Mission $250k was selected. Before the ball can be virtually drilled, the drilling parameters must be filled in: Pin-to-PAP distance, MB-to-Pin-to-PAP angle, Pin-to-PAP-to-VAL angle.
A quick summary of the drilling parameters:
- Pin-to-PAP distance controls the amount of flare of the drilled ball by determining the percentage of the maximum flare potential the ball will have;
- MB-to-Pin-to-PAP angle usually varies between 10 degrees and 90 degrees. The bigger the angle, the later the ball will roll. Blueprint will accept values between 0 and 360 degrees;
- Pin-to-PAP-to-VAL angle usually varies between 20 degrees and 70 degrees. The smaller the angle, the quicker the ball will rev up with more transition at the breakpoint. Blueprint will accept values between 0 and 180 degrees.
This is one area in the Blueprint software where bowlers and beginning or intermediate coaches may need some additional examples and/or material in the Help system so that they can fill out these parameters with confidence.
There is an advanced option that can be used to bring up a dialog to enter the exact ball weight and the locations of the CG and PIN. Once the drilling parameters are entered, the ball can be virtually drilled by selecting Drill Ball from the Ball Operations Menu. This is where the CAD software takes over and the holes are virtually drilled. There are extensive checks in place and the drilling process will take a few seconds, so be patient.
This is where the “what if” nature of Blueprint shines. If you don’t like the results (or get an error), simply make changes to the drilling parameters and drill again. Since the ball is virtual, you don’t have to purchase a new blank ball; just keep drilling until you get what you want.
On the lower right of the screen, there is information about the outcome of the drilling. Pay attention to the side and finger weights, as it is easy to have them be larger than the one ounce USBC limit. If this happens, you can either add a balance hole or change the drilling parameters and re-drill. Once you are pleased with the ball selection and drilling results, it’s time to take your virtual ball out to a virtual lane!
Figure 6 shows the Environment screen, which is made active by clicking on the Environment icon on the left side of the current screen.
By clicking on the button next to the Name label at the top left of the Environment screen, a dialog will be displayed that has a list of common Kegel patterns, PBA patterns, and a few typical house shots. Select the pattern you’d like applied to the lane. The screen will show a description of the pattern, an Oil Pattern Line plot, and an Oil Pattern Contour plot. By comparing plots for different oil patterns, you can see likely starting target lines and get a feel for the usefulness of “Pattern Length minus 31”.
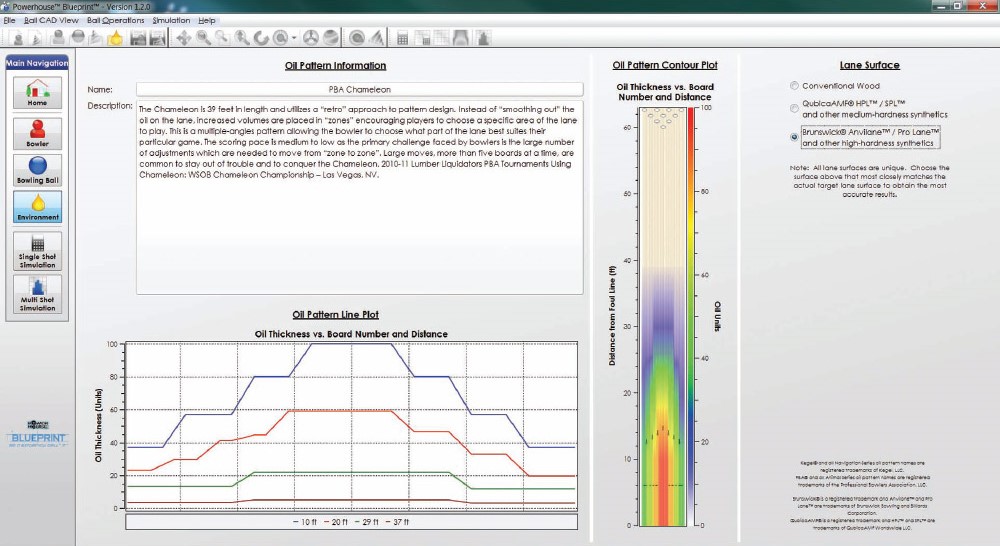
Figure 6. Oil Pattern and Lane Surface
In this case, the PBA Chameleon oil pattern was selected. On the far right of the screen, the lane surface can be chosen. The surfaces available are conventional wood, QubicaAMF HPL/SPL or other medium hardness synthetics, or Brunswick Anvilane/Pro Lane or other high-hardness synthetics. In our example, a high-hardness synthetic was selected.
Now we have a virtually drilled ball and a virtual lane, freshly dressed with our pattern of choice. It’s time to virtually “shoe up and bowl”. Selecting the “Single Shot Simulation” icon on the left brings up the screen shown in Figure 7.
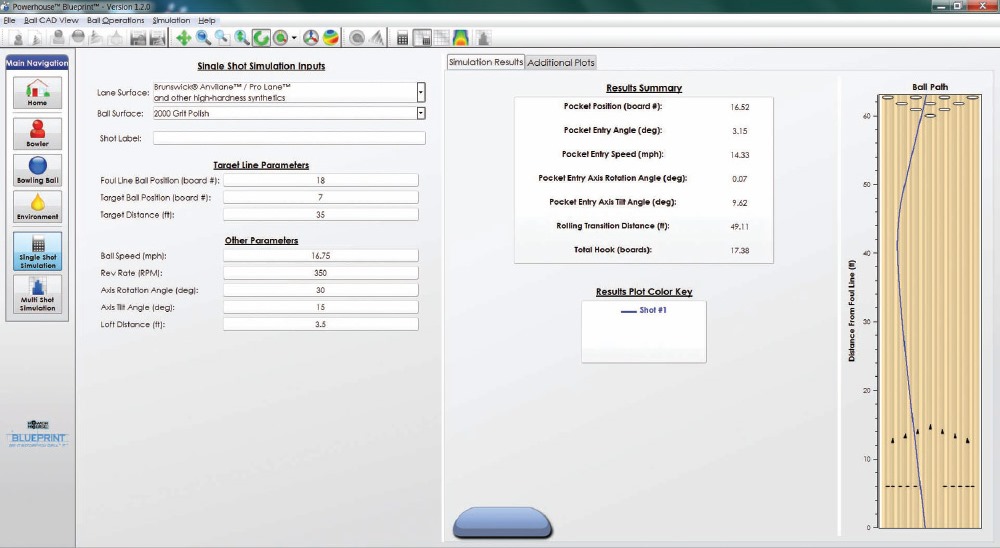
Figure 7. Single Shot Simulation
This screen is where it all comes together. All the care and accuracy put into the values entered will be reflected in the output of the physics-based solver. One of the inputs on this screen is the ball surface, which can be selected from a drop down list. 2000 grit polish was chosen for this particular shot.
Getting lined up
Next, it’s time to get lined up. The board number of the position of the ball at the foul line, the target board, and the distance down lane for the target board are entered into the Target Line Parameters fields. The Other Parameters section contains ball speed, rev rate, axis rotation, axis tilt, and loft distance information and is copied from the Bowler Delivery screen. To deliver the shot, select Single Shot Simulation from the Simulation menu or click on the Single Shot Simulation icon on the toolbar. It’s the icon that looks like a calculator.
Almost instantly you’ll see the results displayed in the Results Summary part of the screen. The values from the screen shot are:
- Pocket Positon (board #): 16.52
- Pocket Entry Angle (deg): 3.15
- Pocket Entry Speed (mph): 14.33
- Pocket Entry Access Rotation Angle (deg): 0.07
- Pocket Entry Axis Tilt Angle (deg): 9.62
- Rolling Transition Distance (in ft): 49.11
- Total Hook (in boards): 17.38
On the far right of the screen, the ball path for the shot will be displayed. Since the pocket is at board 17, at board 16.52 this shot was half a board light. To try again, change the ball surface, target line parameters, or any of the other parameters in any combination and re-compute to get a new Results Summary and Ball Path plot.
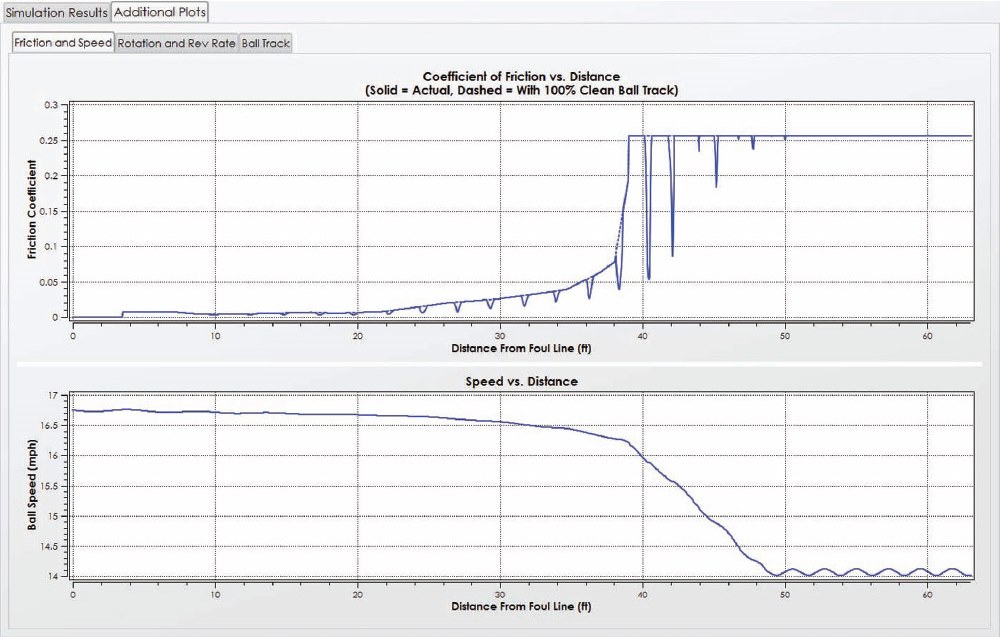
Figure 8. Friction and Speed Plot
There are additional plots available on this screen like Friction and Speed, Rotation and Rev Rate, and Ball Track. Screen shots of these plots are included as Figures 8, 9, and 10 respectively. Definitely take a close look at these plots if you try out the software. It is eye opening how dramatic the ball motion changes at the end of the oil pattern can be.
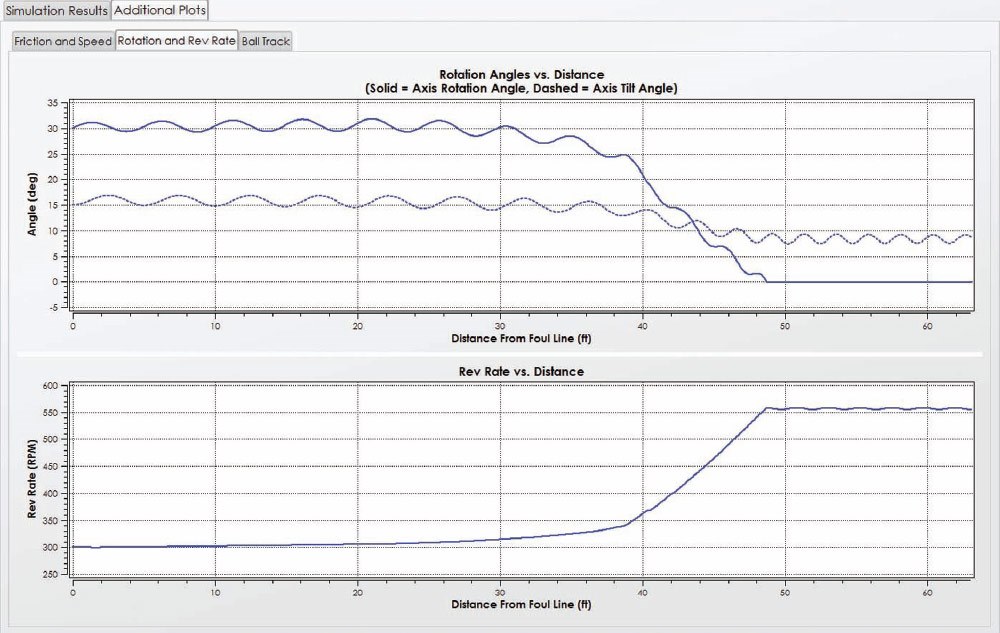
Figure 9. Rotation and Rev Rate Plot
The Ball Track plot is useful to see track flare and to double-check to see if a balance hole is safely out of the way. An example is in Figure 10. There are two sets of tracks on the Ball Track plot: one when the ball is in oil and the other when the ball is on a dry surface.
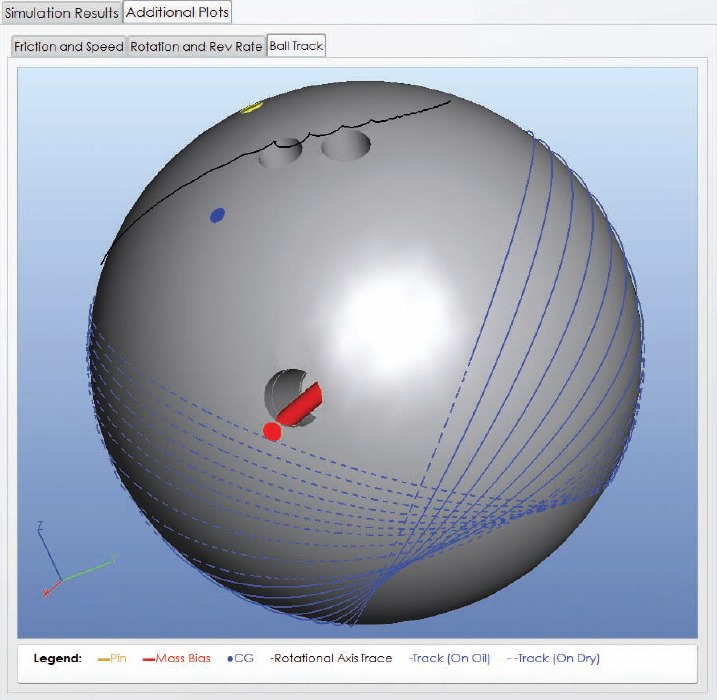
Figure 10. Ball Track Plot
How accurate are simulations?
This is a good time to step back for a moment and ask the key question about simulated results. How accurate are they? Well, first off, the results can’t be any more accurate than the input values. There’s a time honored saying in computing called the “GIGO Law” which means “Garbage In, Garbage Out”.
Simulations in particular are susceptible to this problem. So, how can a user have confidence in the results? It’s up to the producers of the simulation to thoroughly test and validate their software and to explain their procedures to their customers. To Blueprint’s credit, this very topic is addressed in their Frequently Asked Questions page. From their FAQ:
Simulation Accuracy
Software Calibration and Validation
Each ball’s geometry and densities come directly from the ball manufacturer. The same 3D computer model that the manufacturer uses to make a core mold is used as the basis for the model in the Blueprint simulator. The simulator is able to calculate the mass properties of the ball both before and after drilling. To validate this aspect of the software, the calculated mass properties of both drilled and undrilled balls are compared to measurements of actual balls. The positioning of the holes, the static weights of the ball, the mass bias, and the RG values are all validated against actual measurements.
With the mass properties of the ball confirmed, the ball is ready for on-lane testing. Each ball is thrown numerous times on CATS-equipped lanes at Ebonite International’s testing facility. High-speed cameras are used to capture the ball motion and the release parameters of the bowler. Each ball is drilled in both high and low-flaring configurations and thrown on a variety of oil patterns/volumes.
The results of the measurements are used to calibrate the friction characteristics of the ball in the software, and then to validate the motion of the ball. To quantify the effect of surface finish, balls are thrown with a variety of different finishes. Similarly, balls are thrown on several different lane surfaces (conventional wood and various synthetics). In addition to the ball path, the track flare and rotational axis migration of the ball is validated using on-lane testing and high-speed cameras.
When a new simulator is put into service, it can require a small leap of faith that the results are accurate. A simulation proves its worth by generating useful results for many customers over a period of time. For both the vendor and the customers, back-testing against real-world data is an excellent way to validate the results of the simulation. The experience of the vendor, the extent of their testing, and the intended use of the simulated results are all factors in building and growing confidence in a simulation.
Getting back to simulated results, clicking on the “Multi Shot Simulation” icon on the left shows the screen in Figure 11.
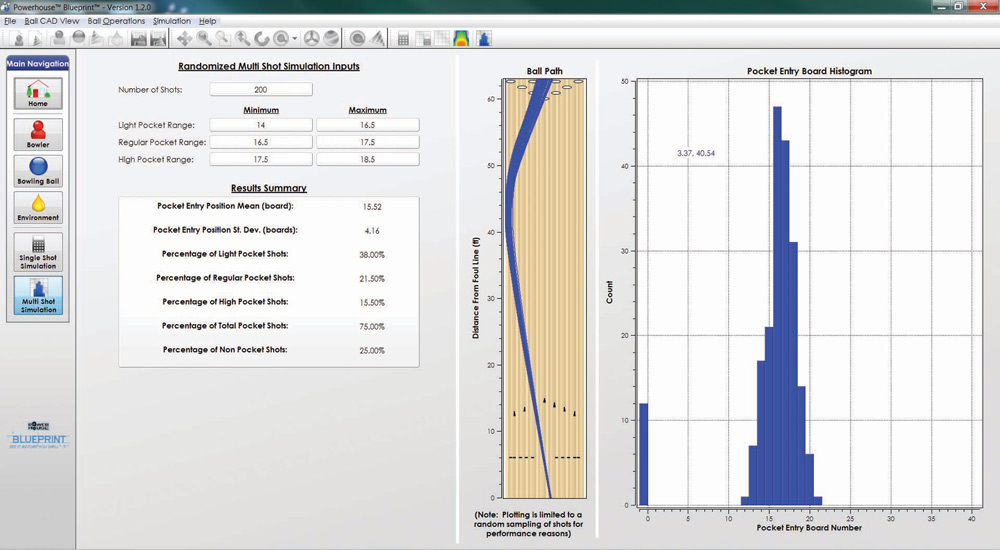
Figure 11. Multi Shot Simulation
Using the values defined on the Single Shot Simulation screen and the Standard Deviations from the Bowler Delivery Parameters, this screen simulates the results of 200 shots and displays a plot and a histogram of the results. The calculations are started by choosing the “Multi Shot Simulation” from the Simulation menu. This will take a few seconds to complete. The Ball Path and Pocket Entry Board Histogram are updated throughout the process.
Because of the small deviations shot to shot, the ball will travel a slightly different path toward the pins. In the example, 75 percent of the shots hit the pocket, meaning 25 percent did not. A breakdown of light, solid, and high pocket hits is provided by percentage. While 75 percent seems like a decent percentage, you can see that 12 of the 200 shots were in the gutter. That’s something to be avoided. Perhaps a new line, a bit less hand, and less surface would help.
Returning to the Single Shot Simulation screen and making a slight target line adjustment, using a rev rate of 320 instead of 380, and 4000 grit polish gives the updated Multi Shot Simulation screen in Figure 12.
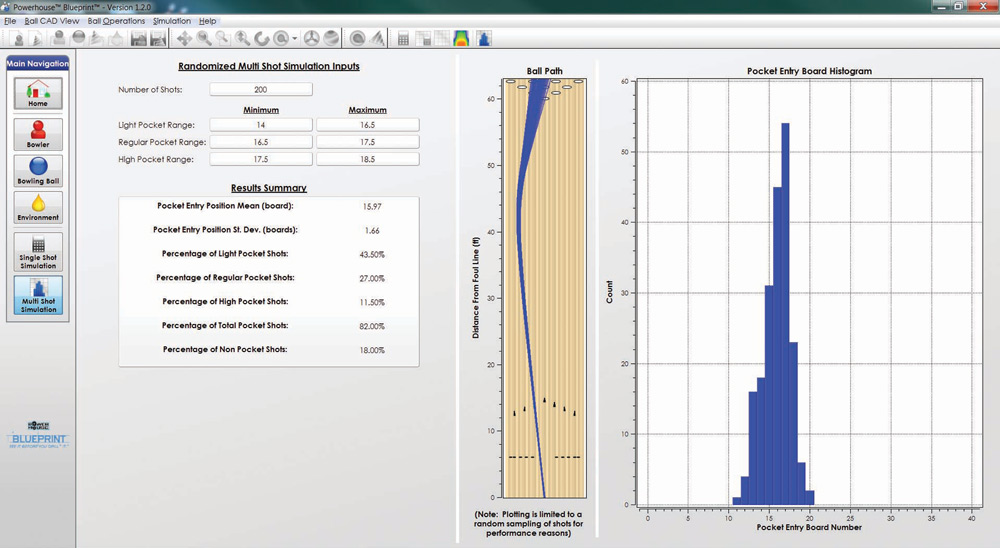
Figure 12. Multi Shot Simulation Revisited
The pocket shot percentage went from 75 percent to 82 percent. More importantly, there are no gutters and fewer shots on the nose (boards 19 and higher). It looks like straighter is greater.
Closing thoughts
Powerhouse Blueprint is a new software tool for the pro shop operator, coach, or hardcore bowler which puts the power of CAD and physics-based simulation into their hands. Blueprint supports drilling a ball virtually and then shows the results of shots made with that ball using the bowler’s unique delivery parameters, all on the bowler’s choice of oil pattern and lane surface.
I’ve spent much of my 25+ years in the computer industry working with and writing simulations of different types and Blueprint is doing it right. Be accurate. Test thoroughly. Build the brand. Extend features cautiously based on customer feedback. Above all, be open and truthful about the strengths and limitations of the software.
Having the right ball in your hand is important, but adjusting to the lanes is crucial, and not all lanes play fair. In a later issue I’ll write about the lane mapping technology another company has developed that can accurately create a topography map of a lane, a map that can then be used to “level the playing field”.
Editor’s Note – Disclosure
Bowling This Month is currently owned and operated by the owner and developer of the Blueprint software reviewed above. This relationship did not exist at the time this review was written.
