Do you prep the surface of your bowling ball? Do you use abrasive pads to change ball motion? Do you try to manipulate the most important factor in ball motion? I certainly do. All of the information I have read and that I have been taught states that bowling ball surface management is critical to keeping my game at the highest level possible. In fact, in 2008, the USBC investigated eighteen variables in a study of ball motion and found that the top three most important variables were related to surface roughness or texture.
In this article, I will share what I have learned from exploring surface management using a scientific approach with a laser surface profiling instrument. What I learned in this study opened my eyes and mind to re-examine my prior assumptions. I hope you will begin to look at surface management in a different light after reading what I have learned.
The device
The device used in this article’s studies was the Ball Surface Scanner produced for Jayhawk Bowling Supply & Equipment, Inc. by Precision Analytical Instruments, Inc. It is a device that uses a laser to scan the surface of the bowling ball and calculate its roughness. Bowling ball surface analysis is its only function.
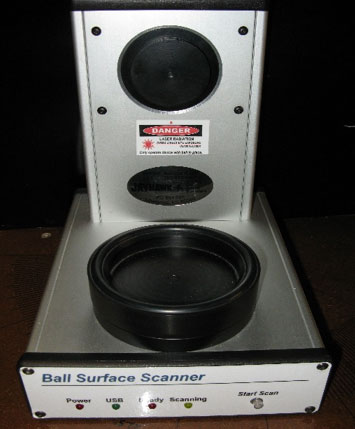
The Ball Surface Scanner is an instrument that uses a laser to measure the surface roughness of bowling ball coverstocks.
The device’s laser takes about 40,000 measurements around the circumference of the bowling ball. The ball can be placed in any configuration on the rotating cup: holes up, down, side, etc. During this study, I used one placement for consistency: my choice was thumbhole to the left, holes up.
I will not bore you with too much unnecessary technology discussion, but understanding the characteristics of a ball’s surface requires knowledge of what the analyzer measures. Two measurements are made by the device: groove depth (Ra) and groove spacing (RS). Ra represents the average peak-to-valley depth of the grooves and RS represents the average peak-to-peak spacing. This is illustrated below.
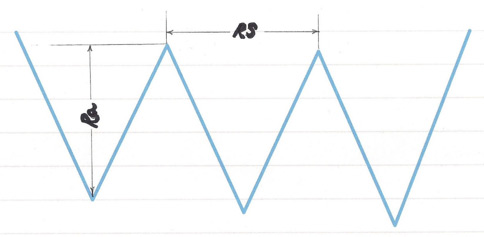
Simplified illustration of Ra and RS
A useful analogy is to think of Ra and RS as they relate to an automobile tire. Think of the depth of the tread as the tire’s Ra. The distance between the treads can be thought of as the tire’s RS value. For a tire, both depth and tread distance provide space for liquid and or soft solids to dissipate. This allows more tire surface to adhere to the surface of the road. The same can be said for a bowling ball traveling through the oiled portion of the lane. More tread equals more space to dissipate oil. This will increase surface contact with the lane, reducing skid and increasing traction.
In the USBC study on ball motion, groove depth (Ra) proved to be the most important factor, while groove spacing (RS) was third. Using these two measurements, the scanner’s software uses the 40,000 data points to produce a graph that depicts the texture of the surface. It is extremely sensitive. It is capable of showing track wear, for example. Below is an example of the kind of data that is generated by the Ball Surface Scanner.
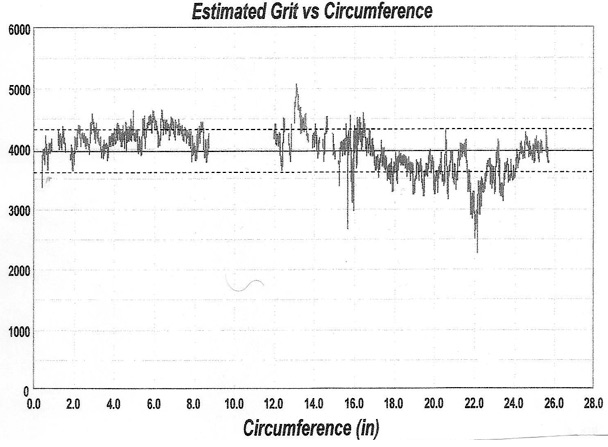
An example of the data produced by the Ball Surface Scanner
Once the scan is complete, the raw Ra and RS values are converted by the scanner’s software to an average grit value and a standard deviation value. The standard deviation is an indication of data scatter or surface texture variation. Smaller standard deviations indicate that the surface is more uniform and larger values indicate that the surface is less uniform.
League bowler study
I brought the scanner along with me on one of my regular league nights. My intentions were to scan my team’s equipment and monitor changes over time. Curiosity over science in progress brought 15 bowlers asking for ball checks. About 1/3 of the fifteen use a spinner and actively practice surface management. The rest regularly clean their ball surfaces and use the pro shop to re-surface or tune their coverstocks.
The results of scanning these 15 bowlers’ equipment were surprising. Their balls’ measured surface finish grits ranged from 3893 to 5429, with an average of 5046.
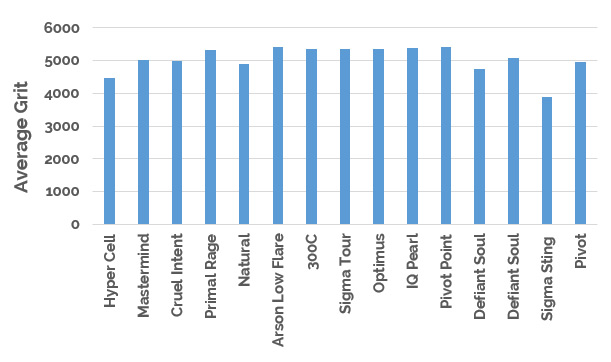
Coverstock surface grits of 15 random league bowlers’ bowling balls
Many of the bowlers who participated in this informal study were surprised by the results. Some thought that the results were erroneous since they did not match their targeted surface textures; they believed their ball surfaces had more texture than the instrument measured. We’ll dive into the reasons for this unexpected result a bit later.
To give some background of this league, the oil pattern is a typical house shot. The most common complaint among our league’s bowlers is that they experience a lot of over/under reaction due to too much conditioner in the middle and very little conditioner on the outside boards. The second most common complaint is a lack of carry, especially in game one and the early part of game two.
Considering the common complaints of the bowlers and the results of scanning their equipment, the solution for many of them would likely be more surface texture, especially through the early portion of the session. Use of the ball surface scanner provided evidence that most of them didn’t have nearly as much surface texture on their balls as they thought they had.
Measured grit vs. applied grit
So, why would a precision instrument produce surface roughness numbers that are so different than what most bowlers would expect? I performed a number of experiments with the ball spinner and the analyzer to try get to the bottom of this and the results were quite illuminating. My experiments were to sand a ball a number of different ways in order to see how the sanding method affected the final measured grit. In each experiment below, a fresh 500 grit pad was used.
Experiment A: Wet sand, four quadrant application, heavy pressure
In this first experiment, I wet sanded the ball with a fresh Abralon pad using a four quadrant method (top, bottom, right side, left side). I used heavy pressure.
Wet sanding seemed to produce a “sludge” that clogged the abrasive particles and reduced the depth for penetration. The resulting surface grit from this experiment was 4285.
Experiment B: Same as A, but with rinsing of the pad between each step
This experiment was the same as Experiment A, except that I added a pad rinsing step in between each of the four quadrant sandings. The hypothesis of this test was that I might be able to achieve a rougher finish by introducing the pad rinse step. However, rinsing the pad did not significantly improve the outcome, with the ending grit coming in at 4099.
Experiment C: Dry sand, four quadrant application, heavy pressure
Dry sanding also produced debris that prevented the abrasive from having full contact with the surface. A final grit of 3890 was achieved with this method.
Experiment D: Same as C, but with vacuuming of the pad between each step
As in the case of rinsing, vacuuming the pad between passes had a minimal effect, resulting in a surface grit of 3664.
Experiment E: Dry sand, two half application, heavy pressure
Next, I moved from a four quadrant sanding process (top, bottom, right side, left side) to a two sided process (top and bottom only, using the bow tie to establish the top / bottom of the ball). This method resulted in a final grit of 3500.
Experiment F: Same as E, but with medium to light pressure
My next experiment was to try using less pressure. This actually had a dramatic effect on the final grit, as using medium to light pressure gave me a final grit of 750.
Experiment G: Same as F, but repeat a second time with a used pad
Finally, I wanted to see how quickly a pad wears down and produces a smoother finish on subsequent uses. For this experiment, I repeated Experiment F, again with a fresh pad, and achieved a grit of 708. Then, I repeated the sanding using the same now-used pad and ended up with a surface grit of 2311.
Perplexed by these results, I called Precision Analytical instruments (PAI) in search of assistance. Why can’t I achieve a surface close to 500 with a 500 grit pad? Is this device calibrated properly? Are the scanner and the pad on identical scales? A lengthy conversation with PAI’s Doug Frank removed my doubts.
I tested several balls during our conversation and relayed my results to Doug. The scanner was indeed calibrated properly. All balls tested in their expected ranges. The scanner and pad did in fact use the same scale.
The problem is that sanding debris quickly clogs the spaces between the abrasive pad’s particles. The debris from the ball is adhering between the granules of abrasive. The debris cannot be removed by thorough strong vacuuming or through rinsing with clean water. The difficulty to remove this debris suggests that it could be melting and fusing between the abrasive particles or that it could be held by electrostatic forces. Check out the photo below of two 500 grit pads.
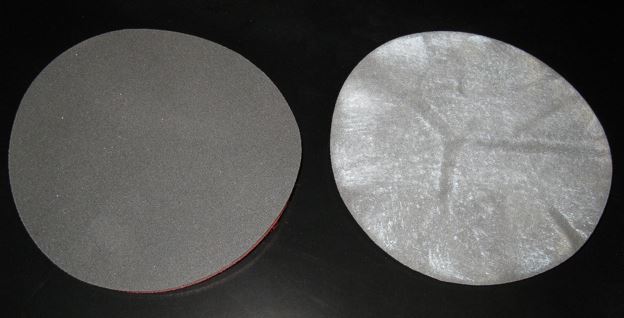
A new 500 grit Abralon pad (left) and a used 500 grit Abralon pad (right)
The left pad is unused and the right pad was used in one trial. You can see that, even after vacuuming, quite a bit of debris remains on the pad. Areas of higher pressure show higher levels of debris.
In summary, my best results were produced with the following method:
- Place the ball with the bow tie up.
- Abrade with medium to light pressure.
- Rotate the ball 180 degrees.
- Repeat step 2.
This method consistently produced surface textures of 700 to 1300 with a fresh 500 grit pad. Using the bow tie as the starting point produces perpendicular grooves to the ball track, which many believe can create a more aggressive ball motion.
Ball maintenance
The importance of maintaining a ball’s surface texture is the subject of a video at Jayhawk’s website. In the video, they show how a ball treated to 2500 grit deteriorates rapidly after one, two, and three games of bowling. A similar test was run with the surface starting at 4700. This ball’s surface did not degrade as significantly. The results for both balls are summarized below.
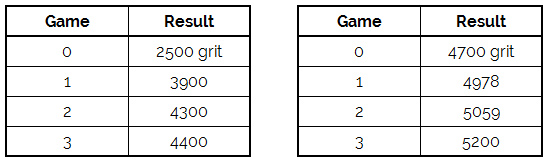
Jayhawk video surface deterioration results
Jayhawk recommends re-treating the rougher ball after three games and the smoother ball between nine and 12 games. These cycles between treatments are shorter than those typically recommended by ball manufacturers. Skepticism again crept into my thoughts and I decided to run my own similar experiment to see if my results matched those published by Jayhawk.
My surface deterioration experiment
I had two main objectives for this experiment. First, I wanted to see if I could replicate the rapid surface finish deterioration that was seen on the rough ball used in the Jayhawk video. Second, I wanted to see if the lane surface’s age and condition played a role in how rapidly the ball’s surface deteriorated with use.
Two bowling centers were chosen for this experiment. One is an establishment (Center 1) with a synthetic lane surface that is less than five years old and that is used mainly for tournament play and training. There is no recreational bowling at Center 1. The second establishment (Center 2) has a synthetic lane surface that has seen over 20 years of abuse. The main use of the lanes at Center 2 is recreational open play, with late nights and weekends getting the heaviest play. Two bowlers participated in this study and they used a mixture of very rough coverstocks and smoother coverstocks for the experiment. The surface grits throughout each of their bowling sessions are summarized below.
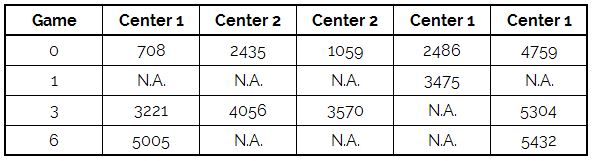
My surface deterioration experiment results
Numerous interesting conclusions can be made from this experiment:
- First, the observations from the Jayhawk video that highly textured surfaces degrade rapidly and that smoother surfaces change less significantly appear to be true in my experiment as well. Note in particular the very rough ball that started at 708 grit and rapidly smoothed to 3221 grit after just three games. At the other end of the spectrum, we see that the ball that started at a grit of 4759 only went up to 5304 after three games of bowling.
- Next, we see that the lane surface condition / age appears to have had a very minor influence in this simple experiment. The entire ball was seen to change as games were completed. Each ball thrown passes down the lane to the pit and returns to the settee area via the ball return. Along the way, the ball must lifted, rotated, rolled down a ramp raised and lifted to the ball return. The ball is subjected to belts, wheels, and tracks that polish the surface. Every time a belt lifts the ball, friction is used as a conveyance that has the potential to polish the ball’s surface. In other words, it appears from this study that all of the non-lane factors contributed so significantly to changing the ball’s surface finish that the actual condition of the lane surface itself was a minor factor.
- Finally, the recommendations to re-treat highly textured surfaces every three games and smoother surfaces every nine to 12 games seem to be good advice.
New equipment experiment
As a final experiment, I wanted to see how the surfaces of new bowling balls compare to the manufacturer-supplied box finish and how the finishes of new balls change over time. For this experiment, two new bowling balls were purchased that had decidedly different finishes.
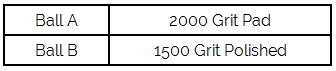
Box finishes of two new bowling balls
Each of these balls was drilled and then their surfaces were tested to determine the starting point as received from the manufacturer. After testing, the balls were used for three games and reevaluated. The results are summarized below.
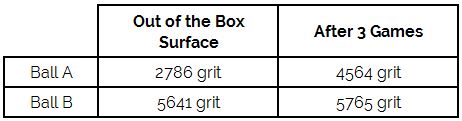
New ball experiment summary
Two things can be learned from this data:
- The surface finish deterioration rate of new equipment is very similar to what was seen above on older equipment.
- The manufacturer-supplied box finish typically represents the surface treatment that was applied to the ball and is not necessarily equal to the resulting grit. Results for each piece of equipment and manufacturer will most likely vary.
Putting surface management to practical use
Recently, I was assisting a young bowler preparing for his first trip to the USBC Open Championships. He coaxed the local lane maintenance employee to apply the USBC team lane pattern for our session. He brought five strike balls and one spare ball to the practice. As the only lefthanded bowler on his pair, he should see a more stable condition than a righthanded bowler. The lane surface and the environment (temperature, humidity, etc.) will be different at the local center, but we should still be able to see if his equipment choices are in the “ball park” during this practice session.
I asked him to warm up with a plan. The exit point we used was the 7-8 board for his warm up shots. He took four shots on each lane without a re-rack to simulate tournament practice and each bowler bowling immediately after the next.
After practice, he bowled through the first eight frames without success. He used all five strike balls in practice and through the completed frames and he experienced very bad ball motion. I inspected his equipment before he started. Each ball had a high sheen. I previously recommended a starting surface on one ball of around 1000-2000 grit and another at 3000-4000. None of his equipment was anywhere near that level of roughness. He swore that his smoothest rolling ball was treated to 3000. We tested the ball on the scanner. The result was 5275 grit.
We discussed once more why a smooth surface would produce a reaction that is difficult to control from the exit point through the breakpoint to the pocket. He allowed me to hand scuff the ball with a fresh 1000 grit pad. The result of the treatment was 3510. His downcast look soon changed to enlightenment and joy. The surface change produced just what he needed on this lane surface and condition. The ball reacted in a controllable manner. He began to strike at will. Four in a row. Spare. Three in a row. Room to the left. Some recovery. The seemingly difficult puzzle was solved. More surface helped produced the desired reaction. Before he left for El Paso we made sure he left with one ball at 1000-2000 grit and another at 3000-4000 grit.
Sum it up
Ball control can be improved through surface management. Knowing your numbers greatly improves your ability to know what works for you on a given condition. Even a 30 year veteran (me) of ball spinner use was astonished by the lack of understanding and inability to produce the desired textured surfaces.
How many of us have discarded dead balls? We all tried abrading to lower grit numbers without any improvement. If we knew how to abrade the surface to reach the proper grit and if we could accurately measure our treatment to insure its accuracy, maybe we could be still using them.
Bowling balls change during a league night or tournament. A ball with a highly textured surface will change considerably after just one game. Is a change in ball motion due to carrydown or oil depletion, or is it simply because the ball surface is getting smoother? Ball surface smoothing is certainly another factor to consider in the ever-changing bowling environment.
To demonstrate consistent ball reaction, the bowling ball surface must be measurably consistent. The Ball Surface Scanner is a tool that allows one to match surface to ball to bowler in a repeatable manner. I urge you to seek out a Ball Surface Scanner at your local pro shop. It can pay dividends. The knowledge you will gain will take your game up another notch.
Acknowledgements
This study could not have been completed without the use of the Ball Surface Scanner. The instrument was provided by Jayhawk Bowling Supplies. Both John Hardman and Russ Wilson of Jayhawk were extremely supportive and helpful throughout the course of this endeavor. Doug Frank, Ph.D., of PAI was also very helpful in providing his invaluable advice and understanding of the software and measuring capabilities of the scanner. Thank you very much to everyone involved.