
About a month ago, the USBC published the results of a recent research project that examined bowling balls and their impact on the bowling environment. This project, which they are calling the Bowling Technology Study, primarily examined bowling ball RGs, differentials, balance holes, and coverstock oil absorption rate through a series of experiments and tests conducted at the USBC’s International Training and Research Center over the last several years.
If you haven’t yet looked at this study, I would encourage you to familiarize yourself with it by reviewing the reports and videos published by the USBC on their website. In total, they’ve provided a 57-page summary report, six summary videos, and 255 pages of additional data and information made available in 22 separate supplementary reports.
While it does take a while to digest all of this, we should all be grateful to the USBC staff members who spent so much time documenting their work and sharing their results with the bowling public. There’s no doubting that a lot of hard work went into this research project.
Introduction
So, why did the USBC spend the last two and a half years performing this research? Well, from the Bowling Technology Study’s web page on bowl.com, they had this to say1:
In a world that is constantly advancing and changing, USBC and bowling are no different. The bowling ball, and its position in the hand of a bowler and its contact with the lane, is something USBC always will need to research. The manufacturers do their job in continuing to deliver products to make the sport easier for the bowler, and the bowlers also continue to evolve in incredible ways.
So, as the National Governing Body for the sport of bowling, USBC constantly needs to measure the effects on the sport of every variable.
If you’ve followed the industry news at all over the past couple of years, I think you’d probably agree that it’s fair to speculate that a big driver of this research was likely the USBC’s exploration of possible equipment specification changes. While not much has been said publicly about the spec changes that are currently being considered, there has been considerable reporting and speculation on this topic over the last few months in the bowling media.
In general, the focus of possible future regulation seems to be on two main areas: limiting bowling ball core/dynamic strength and limiting bowling ball coverstock strength. More specifically, the proposals—as reported by Jeff Richgels and 11thFrame.com2—include the following:
- The complete elimination of balance holes, along with a relaxation of the static imbalance rules.
- A new specification limiting coverstock oil absorption rate.
While I’m personally neither for nor against specification changes in general, I think it is important to proceed very cautiously with modifications to the rules that govern our sport. Any change in this area has the potential to impact the sport and the industry very broadly, and these two changes are certainly no exception.
Given all of that, it seemed worthwhile to me to spend some time analyzing the USBC’s research efforts—both past and present—to try to understand what led us to these proposals. While I’ll share my thoughts in detail below, the bottom line is this:
- I’m not convinced that the balance hole elimination and static imbalance proposal will have the intended effect.
- Also, there are a lot of unanswered questions that leave me skeptical about the proposed oil absorption rate specification.
Before we dig into the details, I want to make one thing clear: I don’t have any particular agenda here. I’m writing this as someone who loves the sport of bowling and who wants what’s best for the sport of bowling. I’m not pro-regulation, I’m not anti-regulation, I’m most certainly not anti-USBC, and my intent here isn’t to be critical of the USBC’s work or motives. I’m just sharing my thoughts and concerns as an outsider, in hopes that someone who is in a position to listen might find them helpful.
Differential
A significant portion of the Bowling Technology Study focused on quantifying the impact of RG differential on bowling ball performance. And, it appears that controlling differential is one of the main drivers of the proposal to eliminate balance holes. The logic appears to be as follows:
- increased differential results in increased hook;
- balance holes can be used to increase differential;
- therefore, eliminating balance holes will decrease the performance of bowling balls.
The second part of the above statement—that balance holes can be used to increase differential—is pretty much indisputable: a large, properly-placed balance hole can increase a ball’s as-drilled differential by around 0.020″ or so. The first part, though—that increased differential results in increased hook—is a bit more nuanced, at least in my opinion.
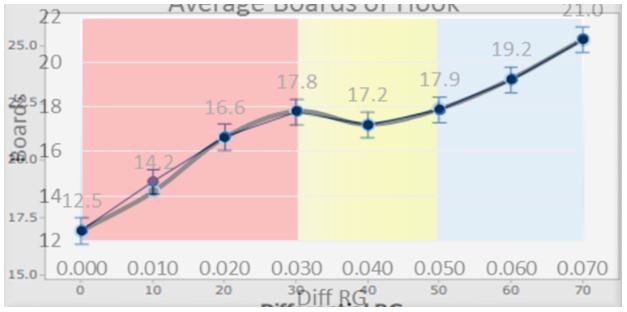
The graph that appears to best represent the USBC’s view on this topic—found both in the Bowling Technology Study‘s final summary report and in one of their summary videos—is as follows4:
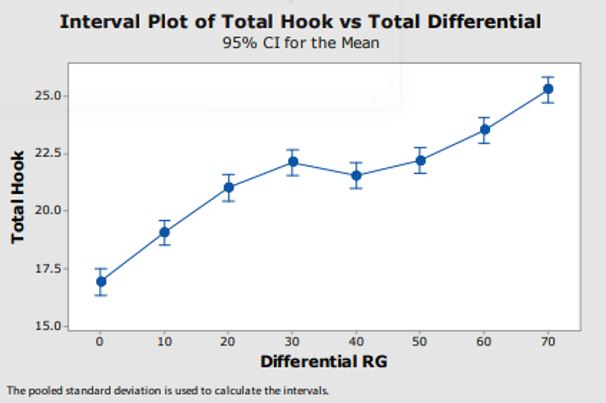
This graph shows up several times in the USBC’s Bowling Technology Study reports and summary videos. At least in my opinion, it appears that this graph represents the USBC’s current view on how differential affects bowling ball performance.
In the above graph, we see total hook increasing as differential increases at the low end, then leveling off for a bit (and even decreasing from 0.030” to 0.040”), and then ramping up rapidly at the high end. Perhaps the most concerning part of this graph is what we see at the high end of the differential range. I think most of us would look at the line in this graph and be left with the distinct impression that it must go up higher and higher—seemingly without limit—as differential is further increased.
My concern here is that the result shown above doesn’t match my own experience on how differential affects on-lane performance. And, further, after digging in and examining the specifics of the USBC’s own test results, I don’t even think that this graph matches their own experience as documented in the Bowling Technology Study‘s reports.
I believe that—with all other things equal—differential should affect a bowling ball’s performance approximately as follows:
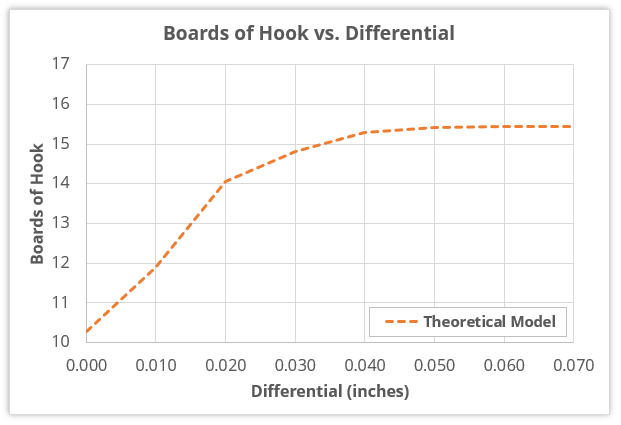
Theoretical model for how differential affects boards of hook when all other things are kept equal. Note that this model assumes a strong layout (3.375″ pin-to-PAP distance) and a medium rev rate bowler (300 RPM).
This is obviously quite different than the graph provided in the USBC’s report, and it paints a completely different picture—especially up at the high end of the differential range—of the effect of differential. As the graph shows, I believe that we should see a non-linear relationship between boards of hook and differential. At the lower end, we should see significant increases in total hook as differential increases. But, these increases should eventually diminish and then level off almost completely at the higher end of the differential range. We can certainly argue about the specifics of where and how the leveling off of hook occurs as a function of differential—and it will likely be slightly different depending on things like coverstock, lane, and oil chemistry, oil pattern, bowler rev rate, drilling layout, etc.—but this general shape is what should be expected when differential is varied as all other things are kept equal.
Why? The reason is that the primary thing that differential creates is the potential for track flare. Track flare helps the ball generate more friction by exposing fresh, non-oil-covered coverstock to the lane on each revolution. But, there is a point of diminishing returns here. Once a ball is flaring so much as to provide “ample” separation between adjacent flare rings, there is very little to be gained by separating the flare rings further. Beyond a certain threshold for flare, the friction increase caused by additional flare become minimal. For the most part, when there is little to no additional friction to be gained as a result of increased track flare, there is little to no additional performance to be gained.
So, what’s behind this model? This particular model was actually generated using a computer simulation that attempted to mimic one of the USBC’s differential experiments. But, there’s really nothing new or earth-shattering here. This “diminishing returns” view on track flare has been known to the industry for a very long time. In fact, the last time there was a proposal to eliminate balance holes, this exact effect was cited by one of the major manufacturers in a video that documented their opposition to the proposal.
Given the discrepancy between my understanding of how differential affects performance and the USBC’s graph from above, I decided to do a pretty deep dive into their data in an attempt to better understand how they produced this result. There are two experiments in particular in their Bowling Technology Study that attempted to isolate the effect of differential on ball motion. And, as I alluded to above, I don’t believe that either of them logically lead to a view on differential that is supported by their above graph. Let’s take a look at each of these two experiments in detail below.
Differential test #1: the EARL test
The first experiment that explored the impact of differential on ball performance used a special test bowling ball thrown by EARL (the USBC’s ball launching robot). This ball could be modified with various inserts/slugs to give it different differential values ranging from 0.000″ to 0.070″. The ball was thrown 30 times at each differential value and the results were averaged to produce a graph much like the one I showed above.
This experiment is detailed in the USBC’s supplementary PDF entitled “Part 1: Differential RG Study.” The boards of hook versus differential graph from that PDF is shown below5:
Boards of hook vs. differential – from the USBC’s “Part 1: Differential RG Study” PDF report
This looks extremely similar to the USBC’s first graph from above, but it actually isn’t exactly the same. If you overlay and scale them, the shape of the curves look pretty much identical—with the exception of the 0.010” differential data point, which is actually slightly different:
An overlay of the above two graphs from the USBC’s reports show that they are extremely similar, but not quite identical.
The reason I bring this up is because I wasn’t able to figure out what exact dataset was used to produce the originally-referenced graph from above. But, since this experiment produced almost exactly the same result, it seems reasonable to use this experiment’s data as a proxy.
One rather large problem with this experiment and the results that it produced is that there were apparently problems that were subsequently identified with the way that it was run. This is acknowledged in the second supplementary PDF, entitled “Part 2: Differential RG Study – Retest,” where the author stated the following about this experiment6:
- The initial ball velocities were inconsistent- speeds were consistent during a test run but varied from test to test. E.A.R.L. setting can be adjusted to achieve consistent speeds.
- The units of oil on the lane varied within a few units- a film of oil was being left on the lanes and not entirely stripped off. Double stripping fixed this issue.
- Abralon pads should have been changed after every test run. Will use new 2000-grit Abralon pads for every test in the future.
- If a test is stopped for a period of time and then re-started again, the results show more hook. Therefore, once started, a test must be run with no extended time delays.
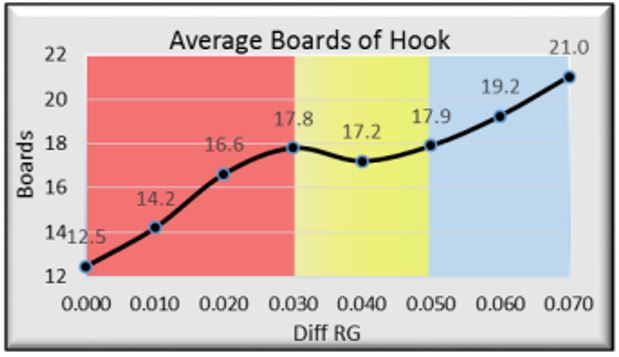
To summarize, four separate things were identified that caused error in this experiment. Based on this, my opinion is that we shouldn’t consider this dataset any further, as the experiment itself was flawed. I assume this must have also been the opinion of the USBC, as they proceeded to fix all four of these problems and then re-ran the experiment. Here are the results from their re-test7:
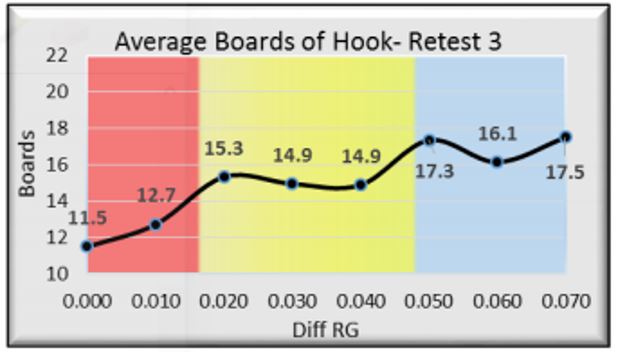
Boards of hook vs. differential – from the USBC’s “Part 2: Differential RG Study – Retest” PDF report
This is a little closer to the result I would expect to see, but it still raises some questions:
- Why do differentials of 0.030” and 0.040” hook LESS than 0.020”?
- 0.050” and 0.070” were basically the same, but for some reason, 0.060” hooked significantly less. Why would that be?
My opinion—which is based on my experiences in trying to interpret data from similar experiments—is that it is very, very, very difficult to do an experiment like this that completely controls for all of the outside variables such that you don’t end up with a significant amount of variation, error, and uncertainty in your results. So, my opinion here is that a lot of the strange up-and-down motion in the above graph is probably just the result of the data being very noisy. After all, I really don’t think anyone would actually believe that the effect of differential on boards of hook is that it causes it to go up, then down, then up, then down, and then up.
Luckily for us, in addition to supplying the summary graph shown above, the USBC also provided the source data—that is, the results from each of the 30 shots that went into the averages that were used to generate the summary plot. This allows us to at least get some insight into the quality of this experiment. Here’s how the shot-by-shot data looks8:
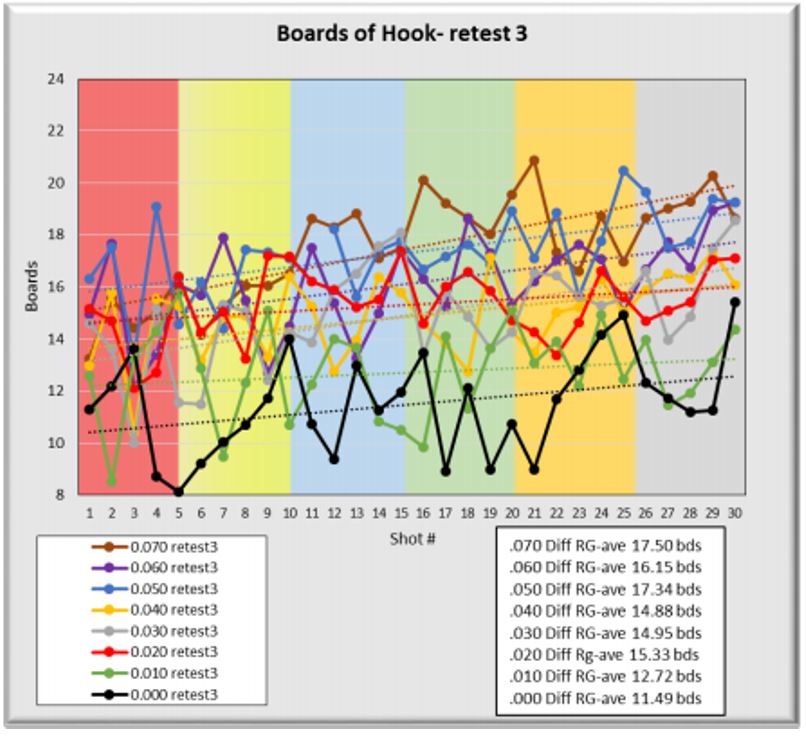
Boards of hook for each individual shot – from USBC’s “Part 2: Differential RG Study – Retest” PDF report
This graph shows two important things that deserve some attention, in my opinion. First, there is clearly an enormous amount of seemingly-random variation from one shot to the next. To some extent, of course, that’s to be expected: the ball surface is slightly different each shot, the oil pattern changes slightly with each shot, and the robot certainly isn’t perfect—even though many of us might be inclined to assume that a robot should be perfect. But, all of that said, this data looks far worse than most of us would have probably expected: for example, looking at one sequence of consecutive shots, the ball hooks 18 boards, then it hooks 12 boards, then it hooks 19 boards, then it hooks 15 boards, etc.
As an outsider to this test, I certainly can’t say with any confidence what all the causes of this variation were. But, having dealt with experiments and data like this quite a bit in the past—and having watched a lot of recent video of EARL throwing shots—I would suspect that there could have been some shot-to-shot launch angle variation affecting the accuracy of this test. Reading the details of how this test was set up, it appears that there was no attempt to correct for this potential source of error. And, maybe that was the right decision: it is easy to inadvertently “correct away” actual ball motion differences that occur in the front portion of the lane when you attempt to adjust the data to account for this factor. At any rate, though, I guess the bottom line is that this data is all over the place from one shot to the next. For better or worse, it is what it is.
The second thing that this graph suggests is that oil pattern breakdown is occurring over the course of the 30-shot sequences, as evidenced by the upwardly-sloping trend lines. That’s not inherently bad, depending on what the goal of the test is. But, it adds another variable—and another potential source for error. For example, looking at the slope of the trend lines, it seems that the 0.030” differential ball’s total hook increased more from start to finish than the 0.040” differential ball. Would anyone expect an 0.030” differential ball to cause more oil breakdown than an 0.040” differential ball, all other things equal? No, probably not. This is likely just what randomly resulted from where these 60 shots happened to be randomly thrown. If you ran this test again, you might get the exact opposite result.
I guess my point is this: if we’re trying to understand how differential affects the ball’s performance, it might be better to isolate that objective as much as possible from other variables—at least initially. Once we’ve nailed down an understanding of how differential affects performance for a given shot, perhaps we could then explore the role differential plays in oil pattern breakdown rate. But, to include both of these factors in the same test just muddies the waters. And, in this test, that’s exactly what was done. Their report actually states that their specific objective was to cause the 30 deliveries to create oil pattern breakdown: every five shots, the robot was moved in 1.5 boards at the foul line and 1 board at the arrows—which put the ball at approximately the same place toward the end of the oil pattern throughout the test—in order to create maximum oil depletion in this lightly-oiled portion of the lane.
Is there any way we can attempt to remove or minimize the effect of oil pattern breakdown from this dataset? Well, we can’t go back in time and change the robot adjustment scheme (by moving 2 boards parallel to the inside every few shots, for example), but what we can do is look at a more limited subset of shots. If 30 shots produced X amount of oil breakdown, then the first 10 shots likely would have produced significantly less than X amount of breakdown. To that end, here’s an approximation (based on manually pulling the shot-by-shot data off the above graph) of what the boards of hook averages would look like if we only included the first 10 shots:
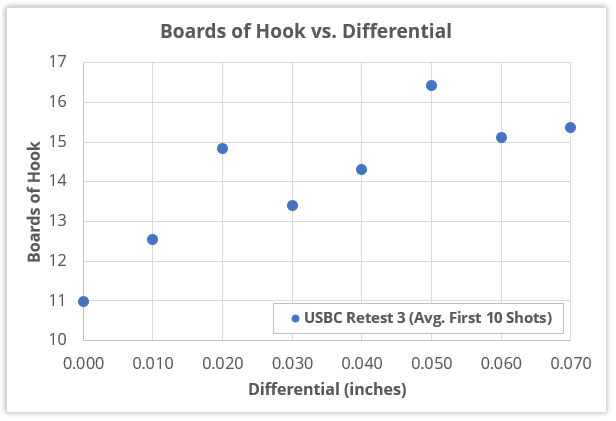
Boards of hook vs. differential – using first 10 shots of “USBC Retest 3” data
As you can probably see, this data looks quite a bit less smooth than the original averages from above that included all 30 shots. But, that’s to be expected: the source data is very noisy, so including less of it in these averages will inevitably lead to noisier averages. That said, this data at least attempts to better minimize the effect of the oil pattern breakdown that occurred throughout each sequence of shots. In my opinion, attempting to minimize this impact will lead us to a more accurate representation of how differential affects ball performance.
So, where does that leave us with this experiment? Well, here are my opinions:
- There’s so much variability in the shot-to-shot performance in this test that it doesn’t really seem practical or valid to use this data to discern small performance differences between the various differential levels.
- With that in mind, I believe this test was probably good enough to show that there are significant performance differences between very low differential balls and very high differential balls (for example, 0.000″ to 0.010” versus 0.060” to 0.070”).
- However, I don’t believe this test was accurate enough to reliably discern smaller performance differences (such as what might or might not exist between 0.060” and 0.070” differentials, for example).
Finally, let’s revisit the boards of hook versus differential model that I presented earlier. It is shown below, along with the first-10-shot averages data from the USBC’s experiment:
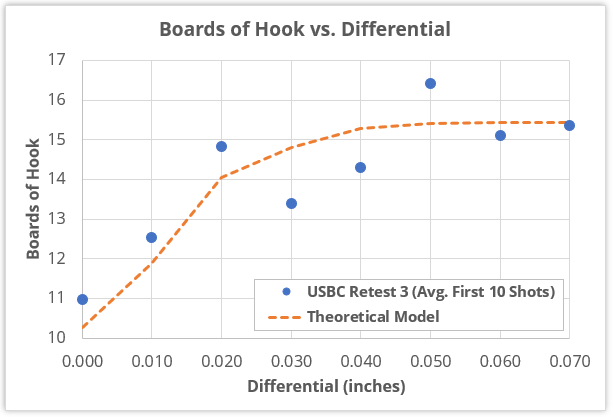
First 10 shots of “USBC Retest 3” data compared to theoretical model of total hook vs. differential
While this model still doesn’t match exactly with what the USBC’s test showed, it really isn’t that far off. Given the amount of random noise, uncertainty, and uncontrolled factors that are inherent in a physical experiment like this, it is quite plausible to suggest that their results are more or less in agreement with my theoretical model. And, at the very least, this sure looks a lot better to me than the graph that made its way into the USBC’s final summary report, which—in case you’ve forgotten—showed fairly large hook increases as differential went from 0.050″ to 0.060″ to 0.070″.
Differential test #2: the bowler test
As I mentioned earlier, the Bowling Technology Study also included a second experiment that allows us to explore the impact of differential on ball performance. If you’re following along, this one is summarized on pages 14 through 18 of the study’s main summary PDF, and additional details are provided in the “Part 13: Bowler Test Results” supplementary PDF.
This experiment used nine test balls that the USBC had manufactured that had every combination of RGs of 2.50”, 2.60”, and 2.70” and differentials of 0.030”, 0.060”, and 0.080”. In this test, a real bowler was used to throw the balls. 10 shots were thrown with each test ball, the outliers (where the bowler obviously threw an errant shot) were discarded, and then the results for each ball were averaged.
The results that were published for this experiment included average entry angle and average ball position at 60 feet for each of the nine balls9:
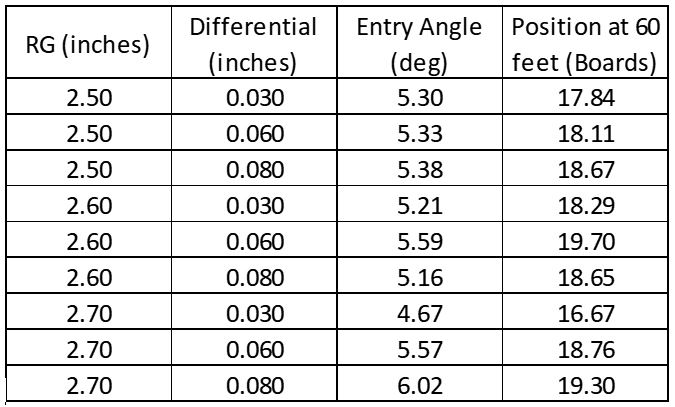
Entry angle and ball position at 60 feet results – from the USBC’s “Part 13: Bowler Test Results” PDF report
It’s a bit tough to see anything definitive from this table, but it is a little easier to digest when we average these results based on differential:
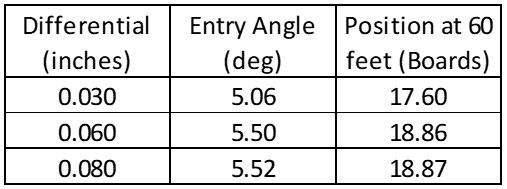
Entry angle and ball position at 60 feet, averaged by differential value – from the USBC’s “Part 13: Bowler Test Results” PDF report
From the above averages, we can see that, on average, the 0.030″ differential balls hooked about a board less than the 0.060″ differential balls. And, the 0.060″ differential balls hooked, on average, pretty much exactly the same amount as the 0.080″ differential balls.
Now, this is all fine and well so far. In fact, this is exactly what I would have expected to see. My concern here is with what the USBC deemed as the takeaway from this experiment10:
The data shows a bowling ball with 2.7 RG has a significantly different reaction in its ball path (a nearly three-board difference) and entry angle (1.35 difference) when the differential RG was set at .030 and then at .080.
Well, yes: the above statement is technically true. But, what about the rest of the data? When you do an experiment—one that almost certainly has a lot of error and uncertainty—I don’t think it is safe or proper to only look at one-third of the data when forming your conclusions. When you include all the data from this experiment, the takeaways are a little bit different:
- On average, the 0.030″ differential balls hooked about 1.3 boards less and had about 0.4 degrees less entry angle than the 0.060″ differential balls.
- On average, the 0.060″ and 0.080″ differential balls performed essentially identically to each other with respect to both hook and entry angle.
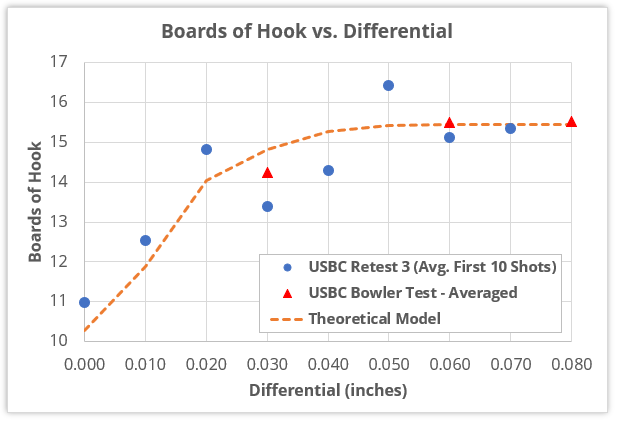
Again, let’s return back to my theoretical model of how I believe differential affects performance and see how this experiment’s data looks by comparison (note here that this experiment’s data was uniformly shifted to match the general level of hook from the previous experiment):
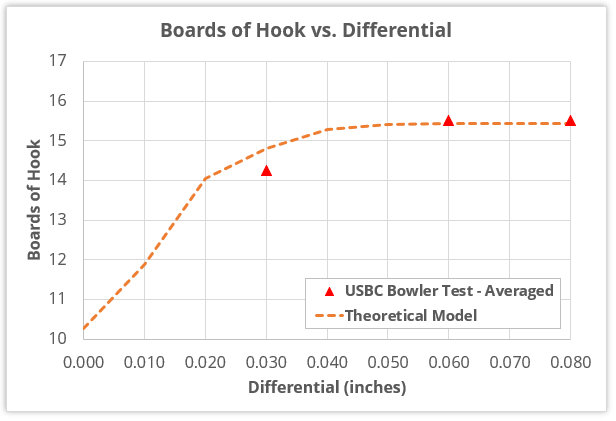
USBC’s bowler test data (averaged) compared to theoretical model of total hook vs. differential
As with the previous study, this experiment’s data seems to line up pretty closely with the model. And, again, this result doesn’t look anything at all like the graph from the Bowling Technology Study‘s final summary report, which—in case you’ve again forgotten—showed fairly large hook increases as differential went from 0.050″ to 0.060″ to 0.070″.
Implications to balance hole elimination proposal
The only reason any of this matters right now is because of the proposal to eliminate balance holes. If you believe 0.070″ and 0.080″ differential balls hook significantly more than 0.060″ differential balls, then the proposal to eliminate balance holes might make sense—especially if the USBC’s goal is to reduce the performance of bowling balls to below their current levels. But, if you’re like me and you think that the extra 0.010″ or 0.020″ of differential that a balance hole can provide to an already-high-flaring ball does almost nothing to its performance, then this proposal makes very little sense.
The elimination of balance holes would basically take as-drilled differentials of around 0.065″ and above out of play. I believe this will have little to no measurable impact on limiting ball performance.
I believe that eliminating balance holes will create a lot of confusion, it will cause a lot of hassle and expense for everyone involved, and it will provide essentially no benefit in reducing the performance level that can be achieved in the future below what can be achieved under today’s current rules.
Static imbalance
I know that no one ever wants to talk about static imbalance these days, but right now is actually a good time to bring this topic up again.
As I mentioned in the introduction, one of the elements of the reported balance hole elimination proposal is a relaxation of the static imbalance rules. Current rules allow for up to 3 ounces of top/bottom weight and up to 1 ounce of positive/negative side weight and finger/thumb weight. The new proposed limits are 3 ounces for top/bottom, positive/negative side, and finger/thumb.
One big omission from the Bowling Technology Study is that it doesn’t even mention static imbalance. Now, I know that most reputable pro shop operators and other experts nowadays widely agree that the effect of static imbalance is minimal. I’m not disagreeing with that. In fact, I mostly agree: within the bounds of the CURRENT specifications for static imbalance, its impact is negligible in most circumstances.
However, it should always be remembered that this is an area where we have a fairly tight spec right now. Imagine, for example, that we lived in an alternate universe where we had an extremely tight specification on coverstock technology (say, for example, that only polished polyester covers are allowed) and an extremely lax static imbalance spec (say, anything less than 8 ounces of imbalance in any direction is allowed). Under those rules, we’d probably all be running around talking about how important static imbalance is and how unimportant coverstock is. In today’s bowling environment, under today’s rules, we actually have the exact opposite scenario. So, when people say, “Static imbalance doesn’t matter,” what they should actually be saying is that, “Static imbalance doesn’t matter within the bounds of the current specifications.” This might seem like an unimportant distinction, but it actually isn’t.
The hard truth of the matter is this: as long as we bowl in the Earth’s gravity field, there will be a point at which static imbalance can start to matter significantly. Since the rule change proposal calls for allowing TRIPLE the currently-allowed amount of side weight and finger/thumb weight, it seems like it would be important to understand the implications of this on ball performance.
I’ve looked at a lot of hypothetical scenarios around these newly-proposed static imbalance limits, and here’s what I’ve found: these new rules as proposed would put us in a place where the impact of static imbalance can become quite significant in some situations. In fact, it’s even worse than that: in some situations, the new set of proposed rules—with no balance holes allowed, but with static imbalance of up to 3 ounces permitted on all three axes—can allow for more performance than anything you can achieve under the current rules.
In other words, this particular rule proposal—eliminating balance holes while simultaneously loosening the static imbalance limits—represents a step in the wrong direction if the goal is to limit ball performance.
To give a little bit more context, please understand that I’m talking about fairly extreme situations here. If we all take our existing balls, plug the balance holes, and then call it a day, we generally aren’t going to see performance increases due to static imbalance that are anything to worry about. But, over time, as people start trying things that are more extreme (but still perfectly legal), the situation changes.
For example, the lower speed, lower rev rate bowler in particular will eventually discover that there are layout and static imbalance combinations that can provide significantly more entry angle than anything that can be achieved under today’s current rules.
To me, this situation seems problematic. If we’re eliminating balance holes because we think it will help limit the performance of the ball, how can we justify simultaneously relaxing a rule that can lead to increased performance?
I believe it is the USBC’s intent to further explore the impact of static imbalance prior to adopting this proposed rule change. That, of course, is a great idea. Some of their more recent attempts at quantifying the impact of static imbalance don’t exactly leave me feeling like they have much of a handle on this variable:
- In 2007, a report11 was published showing the on-lane performance difference between a ball with 1.25 ounces of positive side weight and a ball with 1.35 ounces of negative side weight. This report shows that there were significant performance differences between the two balls.
- In 2008, the USBC’s Ball Motion Study12 included side weight, top weight, and finger weight as variables of interest. The study’s final report indicated that static weights were basically the least important ball-related factors in ball motion. However, it should be noted that—at least in my opinion—there were many things about this entire study that were flawed. With respect to static imbalance specifically, one concern I have is that every ball used in this study was drilled exactly the same. This, I assume, would limit their final static weights to a fairly narrow range. How do we explore the impact of a variable when every ball in the test had close to the same value for that variable? I sure don’t know.
- In 2011, a report13 was published that focused specifically on static imbalance. This report details a series of experiments that used balls with a very wide range of static imbalances, often thrown at very strange combinations of ball speed and rev rate. The main takeaway from this test was that the current static imbalance limits needed to be retained, in part because when they went beyond the current limits in their testing, significant changes to the motion of the ball were observed.
So, where does that leave us today? Well, I think it’s fairly safe to say that more work needs to be done in this area. And, it needs to be done very carefully, because it can sometimes be tricky to accurately measure the impact of static imbalance. For example, it’s completely possible to design an experiment that makes static imbalance look insignificant. But, it’s also completely possible to design an experiment that makes static imbalance look important. I think we’ve all seen examples of both over the years!
If we’re going to be making rules changes relating to static imbalance—and, quite frankly, even if we’re not—I’d personally really like to see some high-quality research done in this area so that we can finally put this topic to rest once and for all.
Coverstock oil absorption rate
Don’t worry: I have far less to say about coverstocks. One reason for this is that I don’t consider myself to be qualified to talk much about the specifics of coverstocks. But, another reason is because the USBC’s Bowling Technology Study doesn’t really go into that much detail about coverstocks, so there’s not all that much to comment on.
Let’s start with a look at some of the current specifications that exist relating to coverstocks14:
- Surface hardness must be 72 or greater (as measured with a Shore durometer, type D).
- Dry lane coefficient of friction (COF) must be 0.320 or less.
- Surface roughness (Ra) must be 50 micro-inches or less.
The USBC’s current interest in coverstocks seems to focus entirely on a different characteristic: oil absorption rate. In fact, most of the coverstock portion of the Bowling Technology Study focused on the USBC’s efforts to develop a test for measuring this characteristic. Since I personally have no experience whatsoever measuring coverstock oil absorption rate, I really can’t comment intelligently in this area. My questions and concerns are actually focused a bit upstream of this.
Let’s start with the existing surface roughness spec. This rule was put in place back around 2009. I think we’d all agree that, since 2009, covers have gotten significantly stronger. Why is that? The USBC determined in the 2008 Ball Motion Study that surface roughness was “by far the greatest contributor to ball motion”15 and then put a surface roughness specification limit in place in response. Why was this spec so apparently ineffective in limiting the further strengthening of coverstocks? Did the Ball Motion Study somehow overestimate the importance of surface roughness? Or, was the limit simply set too high to have any significant impact?
I have similar questions and concerns about the dry lane coefficient of friction spec. This spec has been in place for many years, yet we never talk about it. It’s not clear to me if this spec has played any meaningful role in limiting the strength of coverstocks over the years, but I suspect that its role has been minimal. Is the 0.320 limit simply too high to have any real effect? Is the USBC’s method of testing coefficient of friction—dragging a non-rotating ball across a dry lane panel—not representative enough of the conditions the ball encounters in the real world to produce accurate and relevant data? Or, is there something else about this spec that has made it so apparently ineffective in limiting the strength of coverstocks?
I personally feel like these are all questions worth answering. I’m happy to give a free pass to the hardness spec: that one was put in place decades before we even had reactive resin bowling balls. But, the other two existing specs—for surface roughness and for dry lane coefficient of friction—are resin-era specs. Why does it appear that they weren’t very effective?
Let’s get back to oil absorption rate, which, as mentioned previously, is the new coverstock characteristic that would be limited under the USBC’s latest proposal. How does oil absorption rate affect ball performance? Well, unfortunately, no data is provided on this in the Bowling Technology Study. Yes, it’s true that the 2008 Ball Motion Study deemed oil absorption rate to be an important factor (albeit, a much less important factor than surface roughness) in ball performance. And yes, we’ve all heard anecdotally that high performance balls often tend to absorb oil faster than low performance balls. While all of this might be true, it would be nice to see some data that at least shows how oil absorption rate correlates with on-lane performance. Correlation, of course, does not imply causation, but it’s at least a start. A simple scatter plot showing some characteristic of on-lane performance (total hook, for example) versus oil absorption rate for all the balls tested thus far by the USBC could serve this purpose.
And finally, one of the things that is touched on by the Bowling Technology Study is the exploration of oil pattern breakdown rate versus coverstock oil absorption rate. One of their experiments on this showed no impact, while one of their other experiments showed some impact. That’s interesting, but how confident are we at this point that limiting oil absorption rate will lead to reduced oil pattern breakdown rate in the real world? Would a very high oil-absorbing ball finished at 4000 grit break down an oil pattern faster than a more moderate oil-absorbing ball finished at 500 grit? Similarly, would a moderate oil-absorbing resin ball finished at 4000 grit break down an oil pattern faster than a completely non-oil-absorbing urethane ball sanded to 360 grit? I personally have my doubts, and I think this is an important thing to consider before putting a new spec in place—assuming, of course, that this is one of the motivations of this proposed spec. If we make covers weaker, will bowlers just use more surface to compensate? And, if so, will this use of rougher surface finishes cause oil patterns to transition as fast—or perhaps even faster—than they do today?
Maybe the proposed oil absorption spec makes sense. Maybe this time, it’s different. To me, though, it’s just not obvious from the data that has been published that this is the right move, right now.
Closing thoughts
The sport of bowling has certainly been influenced by technology, much like all sports. And, I recognize the tough position that the current USBC finds itself in. We’re having conversations today about bowling equipment that would have made a lot more sense 25 years ago. Unless someone stumbles upon a time machine, it’s difficult to imagine that there are any easy fixes here.
Looking at the current proposals, it should be pretty clear that I’m not particularly fond of the proposed balance hole and static imbalance changes. To me, this proposal doesn’t seem like it has any chance at all of producing any meaningful effect whatsoever in limiting ball performance. I see no upside to doing this. But, worse than that, I see a lot of downside. Balance holes can be useful tools in the hands of knowledgeable ball drillers. If we take them away, we lose the ability to adjust the dynamics of our equipment post-drilling. And, let’s not forgot about the inconvenience of hundreds of thousands of bowlers being forced to have the balance holes plugged on all of their existing equipment. This isn’t the end of the world, of course, but it’s annoying, costly, and seemingly completely pointless.
And, on the coverstock side of things, I’ve laid out my questions and concerns above. I suppose I don’t really have too many doubts as to whether the performance of present-day reactive resin bowling balls can be limited by putting a limit on oil absorption rate. But, that’s also probably what a lot of people thought when the surface roughness spec was introduced in 2009. Also, it just isn’t clear to me what the side effects might be of limiting oil absorption rate. Will people just use more surface in the future and break down the lanes just as quickly as they do today? Will people just hoard a bunch of present-day, high oil-absorption balls in their basements and then never buy anything new again? Will the large majority of purely recreational bowlers who don’t want to deal with all of this just choose not to sanction? I don’t believe that any of these things would be positive side effects.
One final thing that’s not clear to me from everything I’ve read is this: what are the actual, specific goals of the USBC in implementing new bowling ball specifications? We’ve heard things about figuring out “what’s in the best interest of the sport for tomorrow,”16 and protecting the “sustainability and integrity of the current environment,”17 but what exactly do these things mean?
- Is the goal to freeze bowling ball technology at today’s current levels?
- Is the goal to roll back bowling ball technology to some prior era?
- Is the goal to make bowling balls hook less?
- Is the goal to make oil patterns break down slower?
- Is the goal to reduce the amount of oil that is used on each lane?
- Is the goal to reduce wear, tear, and maintenance on lane surfaces and other equipment?
- Is the goal to reduce the scoring pace?
- Is the goal to improve fairness in some way?
What exactly are the specific goals of these proposed specification changes, and why are those the goals? I find it somewhat difficult to evaluate whether these proposals will be effective—and, perhaps whether some other, completely unrelated ideas might be even more effective—when it hasn’t been made clear—at least from my perspective—what problem we’re actually trying to solve.
Looking past the doom and gloom, I think it’s important to remember that, regardless of what happens with any of this stuff, the sport of bowling will most likely survive—at least in some form. Bowling is a great sport, and it’s filled with a lot of great people. It has unfortunately faced a lot of negativity from within in recent years, and I hope no one interprets this article as my entry into that arena. I’ve always tried to steer clear of the drama, the bickering, the finger-pointing, and the blaming, and this article doesn’t change that. Like almost everyone in this industry, I just want what is best for the sport. As such, I felt that it might be worthwhile for me to share my thoughts on this important topic. Thanks for taking the time to read them.
References
2. Richgels, Jeff. “The 11th Frame: Ball companies have until March 15 to respond to USBC’s latest proposed ball specifications — see what they are in this story.” 11thFrame.com. https://www.11thframe.com/news/article/10104/Ball-companies-have-until-March-15-to-respond-to-USBCs-latest-proposed (accessed March 28, 2018).
3. Ibid.
4. United States Bowling Congress. “Bowling Technology Study.” PDF file, 10. http://usbcongress.http.internapcdn.net/usbcongress/bowl/equipandspecs/pdfs/TechnologyStudy/FullStudy.pdf (accessed March 28, 2018).
5. United States Bowling Congress. “Engineering Report: Differential RG Study.” PDF file, 10. http://usbcongress.http.internapcdn.net/usbcongress/bowl/equipandspecs/pdfs/TechnologyStudy/Core/1.pdf (accessed March 28, 2018).
6. United States Bowling Congress. “Engineering Report: Differential RG Study- Repeat.” PDF file, 1-2. http://usbcongress.http.internapcdn.net/usbcongress/bowl/equipandspecs/pdfs/TechnologyStudy/Core/2.pdf (accessed March 28, 2018).
7. Ibid., 2.
8. Ibid., 8.
9. United States Bowling Congress. “Engineering Report: Bowler Test Results.” PDF file, 4-6. http://usbcongress.http.internapcdn.net/usbcongress/bowl/equipandspecs/pdfs/TechnologyStudy/Core/13.pdf (accessed on March 28, 2018).
10. United States Bowling Congress. “Bowling Technology Study.”
11. Ridenour, Paul. “Center of Gravity placement on a symmetrical bowling ball: How critical is it?” PDF file. United States Bowling Congress, 2007. http://usbcongress.http.internapcdn.net/usbcongress/bowl/equipandspecs/pdfs/articles/CenterOfGravityArticle.pdf (accessed March 29, 2018).
12. USBC Equipment Specifications and Certification Team. “Ball Motion Study: Phase I and II Final Report.” PDF file. United States Bowling Congress. http://usbcongress.http.internapcdn.net/usbcongress/bowl/equipandspecs/pdfs/08ballmotionstudy.pdf (accessed March 29, 2018).
13. Brettingen, Patrick and Mours, Nicki. “USBC static weight limits remain relevant.” PDF file. United States Bowling Congress. http://usbcongress.http.internapcdn.net/usbcongress/bowl/equipandspecs/pdfs/2011StaticWeightsStudy.pdf (accessed March 29, 2018).
14. United States Bowling Congress. “Equipment Specifications and Certifications Manual.” PDF file, 5-6. http://usbcongress.http.internapcdn.net/usbcongress/bowl/equipandspecs/pdfs/ESManual.pdf (accessed March 29, 2018).
15. Stremmel, Neil, Ridenour, Paul, and Sterbenz, Scott. “Identifying the Critical Factors That Contribute to Bowling Ball Motion on a Bowling Lane.” PDF file, 11. United States Bowling Congress. http://usbcongress.http.internapcdn.net/usbcongress/bowl/equipandspecs/pdfs/BallMotionASQ.pdf (accessed March 29, 2018).
16. United States Bowling Congress. “Bowling Technology Study.” PDF file, 7.
17. United States Bowling Congress. “Bowling Technology Study.” PDF file, 54.