


When Storm introduced the PSA Drilling Guide in 2005, drilling instructions for balls with a strong preferred spin axis, it was met with a variety of reactions, ranging from “What is a pin buffer?” to “Ah, this explains it!” This guide introduced the Pin Buffer System of laying out balls, which helped bowlers position the pin and PSA in different orientations relative to their PAP.
To understand the Pin Buffer System, one must understand the effects of three critical components. The distance of the pin to the bowler’s initial PAP controls the amount of total flare. The PSA to PAP distance dictates how quickly the ball loses axis rotation (side roll). The pin to VAL distance, also known as the pin buffer, controls the shape of the hooking motion at the breakpoint.
Knowing the layouts, such as 4 x 4 x 2, doesn’t help one understand what decisions were made in order to arrive at that particular layout choice. Hence, we created the VLS, or Vector Layout System.
Nearly five years in the making, the VLS was developed to help users from the pro shop professional to the bowler who has more than one bowling ball. It will also help coaches and proprietors in that it plainly walks one through a series of questions and then calculates the proper Pin Buffer System layout based on the information given.
The powerful yet simple VLS is an easy-to-use program which runs on any version of Excel. And for you Apple users, no worries: there is a free app you can download called CloudOn which will allow you to open, modify, and navigate through the VLS both quickly and easily.
What follows isn’t light reading. Feel free to grab a few Advil now; you can thank me later!
The Vector Layout System
Historically, we have created layout systems that make good generalizations concerning ball motion using only the PAP. However, technology has evolved in such a way that we can further fine-tune ball reaction by using precession to our advantage. Understanding physics and vectors can help us understand why a ball changes direction, but application isn’t easy. That’s why Storm developed the VLS. (See Figure 1A)
An easy-to-use spreadsheet is available free of charge to the public on stormbowling.com beginning June 1. VLS works off a series of drop-down menus that allow it to calculate the proper layout. It takes into consideration the desired ball motion and bowler statistics, as well as the specific RG planes of the bowling ball chosen.
Let’s take a quick look at the lane conditions section, called “Pattern Details” in the spreadsheet. If you click on the right side of that column, you will see the different categories come up. Ranging from very short to very long, you can choose from a variety of pattern lengths (in feet.) (See Figure 1B)
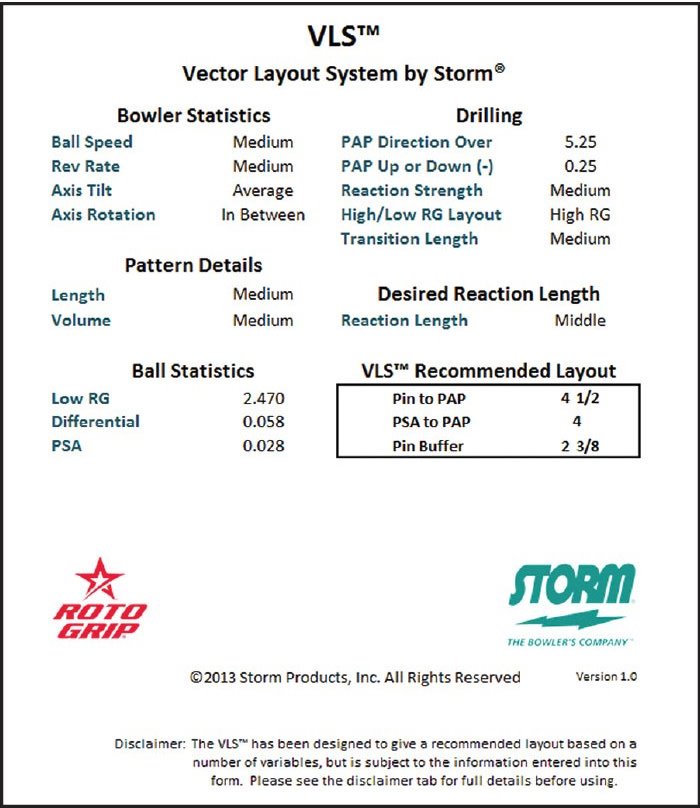
Figure 1A
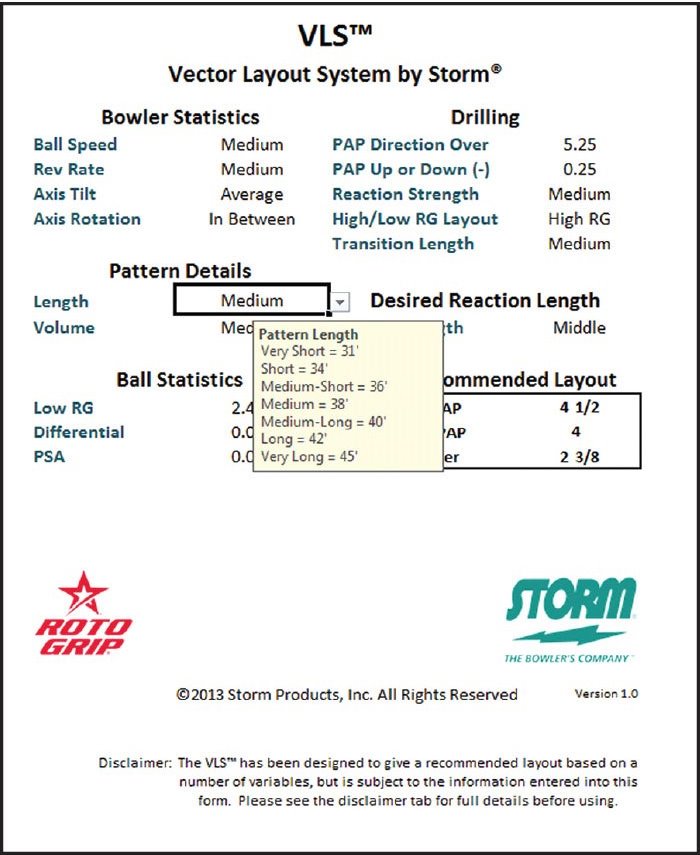
Figure 1B
The methodology for the VLS was done with this same ease-of-use in mind. Answer each of the questions and you’ll be able to see the recommended layout for any bowler, with any ball, for any lane condition. While, of course, we hope that you are partial to Storm and Roto Grip, we decided to make this program available to the entire market in hopes of making better bowlers and pro shops everywhere.
The early testimonials have been astounding! Erik Ramos from Orlando, FL drilled a Lucid for one of his customers who typically has not had much success with asymmetricals due to his high rev rate. This customer has a tendency to drill every ball with a 5 inch pin to PAP below the fingers. Erik tried the VLS the day of our seminar and found that 2¼ x 5½ x 1½ was a good choice. His customer’s first game that night? 300! His series the next night, with the ball he wouldn’t ordinary choose and a layout he definitely would shy away from? 802!
Nick Morgan from Sacramento, CA had a similar story. Game one with the VLS was also 300.
We mentioned earlier that the key to this new system is based on working with the designed RG planes of a particular bowling ball.
Understanding RG planes
You are likely familiar with the term radius of gyration (RG). The RGs are published in the technical data cards and on the box of every Storm ball. By definition, the RG is the distance from the axis of rotation at which the total mass of a body might be concentrated without changing its moment of inertia. The approved RG range for bowling balls is 2.46 to 2.80 inches from the geometric center of the ball. A low RG value indicates the center of gravity is close to the center of the ball, allowing it to rev up more easily, increasing total ball motion.
While this number represents a distance, manufacturers generally do not include the unit of measure. If you look at Storm’s website, you’ll find that the Sync, for example, has an RG of 2.47. This measurement indicates the lowest RG value of that undrilled bowling ball which is the RG of the ball about the pin.
Keep in mind that there are an infinite number of axes that exist and can be measured in any sphere. To better understand RG planes and how they relate to our sport, we’ll focus on three primary axes: X, Y and Z. They represent the minimum, intermediate, and maximum RG values. We have to understand these three main positions before we start filling in the areas in-between and around these points with the varying RG planes.
Looking at Figure 2, you’ll notice that we marked and referenced the pin as the X axis. Since that position is about the pin, that particular RG value is found in only one location in our reference area. In this example, the RG value about the X axis is 2.53.
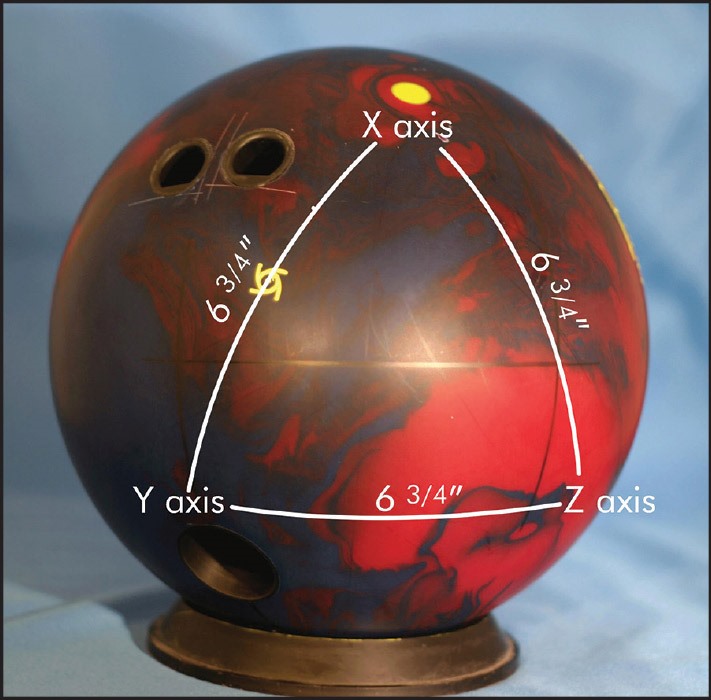
Figure 2
To determine the RG values about the Y and Z axes, we would first need to know if the core or weight block is symmetrical or asymmetrical. When the internal shapes are symmetrical, the RG values about the Y and the Z axes are identical. The actual value can be determined by adding the amount of differential to the RG. The technical data shows that in a 16 pound ball, the differential for the Freak’n Frantic is 0.044. Adding the two together (2.53 and 0.044), you can calculate the RG about both the Y and Z axes to be 2.574.
It’s not just at these two points the RG is 2.574. The RG can be measured all along the white arc connecting the Y and Z axes. Doing so will confirm that the same RG value is present all across the arc. We now have what’s called an RG plane.
When describing the RG planes of balls with a symmetrical core shape like the N.O.S. core found in the Frantic series, the image of the globe works as a terrific example.
Looking at Figure 3, consider the X axis to be the North Pole. Both the Y and Z axes would lie upon the equator. For 16 pound balls with the N.O.S. core, the RG at the North Pole is 2.530 and the RG at all point along the equator is 2.574.
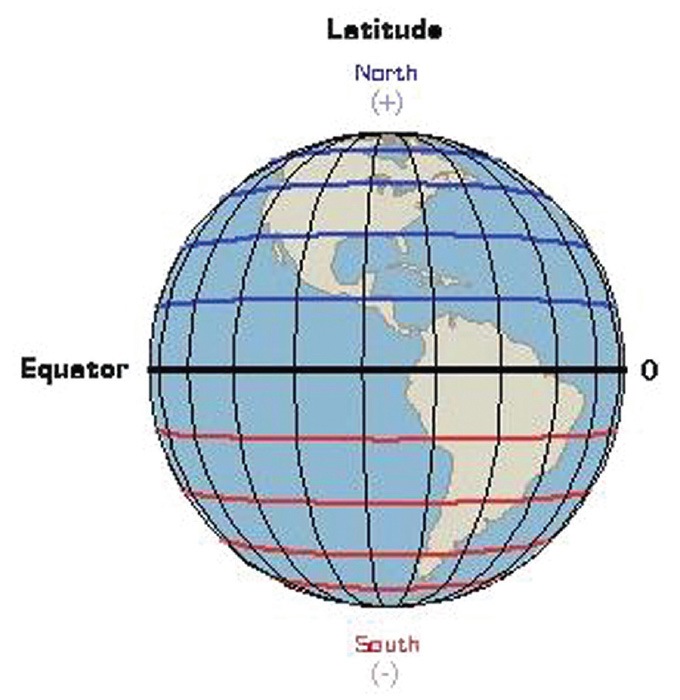
Figure 3
What about the rest of the ball? There are countless arcs and points that lie between the North Pole and the equator. You can see the lines of latitude as indicated by the blue and red lines. We’re concerned only with the blue lines in figure 3. Nothing against South America and Australia (great bowling areas, by the way), but when looking at a bowling ball and trying to manage the axis migration and the bowties, we only need to address the Northern Hemisphere!
Looking at these points in-between, we can measure the RG value at any position. If you were to measure and map out the positions which had similar values, you would find a series of arcs which are circular about the pin and which extend 6¾ inches away to form the equator. These arcs would look just like the blue lines of latitude on the globe as seen in Figure 3.
If you were to use a compass to trace out these arcs, or planes, you would see that at, for example, four inches from the pin, the RG will stay the same all 360 degrees around the ball. Figure 4 shows you the RG values for each plane between the pin (X axis) and the equator (largest plane containing Y and Z axis).
Figure 4
Just as a side note, the X axis extends through the sphere at two different points on the surface of the ball. So, the RG value about the South Pole would be the same as the North Pole, but until you start mapping out balls based on the position 13.5 inches from the indicated pin, you won’t need to worry about that.
Now that you understand the specifics of RG values, RG planes, and how they are distributed on a symmetrical bowling ball, let’s talk about the difference with the same planes on an asymmetrical ball. It’s a whole new ball game!
Contrary to the RG planes in an undrilled symmetrical ball, an asymmetrical core produces RG planes which are not of uniform distance or shape about the pin (X axis). The planes on a Sync, which features the G2 core (Figure 5), look nothing like the image of the globe.
Figure 5
Looking at Figure 5, we can see following any one color takes us along a different shape or path. The shapes about either the pin or the PSA are oval, while the arcs in between are slightly concave or convex. RG planes that look like this indicate the weight block is asymmetrical by design and will have a faster spin time and quicker transition on the lane. Look for these types of balls to produce a stronger reaction, especially for those with low to medium rev rates.
Migration paths
In the old days, ball tracks were a single, thin line of oil or wear that never moved. You could easily identify the most consistent, and often best, bowlers in the center as those with the narrowest ball tracks, which was a sign of a repeatable release. Today, you’ll notice that a bowler has several rings of oil due to the imbalance of the weight block.
Bowlers used to have just one positive axis point, or PAP. What is known as a bowler’s PAP is truly their initial PAP, the point on a ball about which the ball rotates initially upon release. After the first revolution, this position will change, as indicated by the flare rings.
What you see here, as we map out the actual PAPs of differently drilled balls, is that these migration paths vary in both shape and total distance, an indication that a different type of ball motion is being produced as a result of the different core orientation and applied physics. Get ready for some fascinating stuff!
We started by drilling three different Storm Syncs, all with 4 x 4 layouts, but with different pin buffer distances. As we plot the migration paths, notice they each produced different amounts of total flare as well as different path directions.
You can see from the picture in Figure 6 that by simply adjusting the pin buffer distance, we can significantly alter the migration path relative to the grip center. In addition, as you might expect, we changed the breakpoint location and transition shape/length in doing so.
Figure 6
Starting at the left side of Figure 6, the 4 x 4 x 0.5 layout produced the earliest breakpoint and the shortest transition length. This means our testers would line up deeper with their feet in order to hit the pocket. The transition length can be described by how arcing or snapping the motion is when it sees the dry boards. Many people prefer a hockey stick type of shape that really turns the corner (upward direction). On sport conditions, one looks for more control (downward direction).
CATS (Computer Aided Tracking System) graphical analysis – VLS in action
To help understand the Vector Layout System more thoroughly, we drilled the Sync with three different layouts for two different players: one was a tweener with a medium rev rate and axis rotation, and the second was a cranker with a much higher rev rate and an extreme amount of rotation.
We chose three layouts with both the pin to PAP and PSA to PAP measurements identical, but with three different pin buffer differences. All three pin distances from the PAP were identical so as to theoretically produce the same total flare, but we varied the pin buffer distance to alter the migration shape and, thus, ball motion.
Using CATS, the graphical analysis of our medium rev player (Figure 7), shows three different ball paths. The 4 x 4 x 2 layout finished high flush, while the other two finished either high or light. Remember, everything was identical with respect to coverstock, surface preparation, pin to PAP, etc. The only thing that changed was the pin buffer (the distance from the pin to the VAL).
Figure 7
The graphical analysis seen in Figure 8 shows the three different ball paths for our higher rev player. The 4 x 4 x 3.5 layout finished extremely high flush, while the other two finished either Brooklyn or right in the heart of the headpin. With the higher rev rate, we saw greater separation in the ball paths due to the increased hook potential.
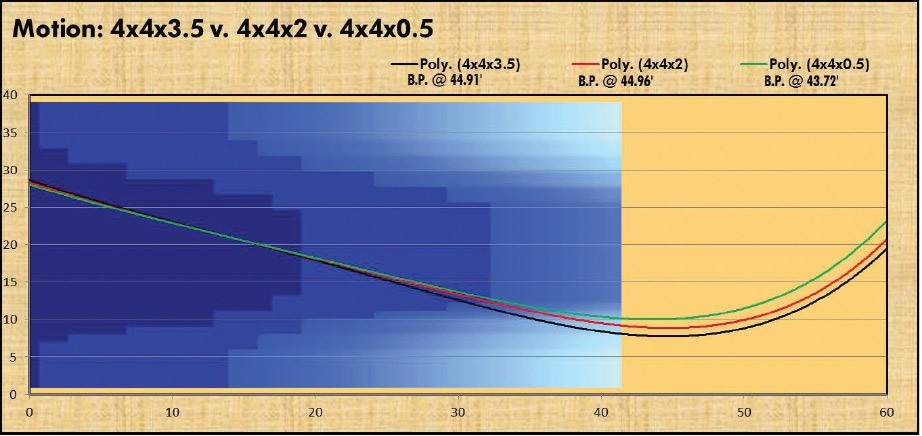
Figure 8
If you throw the ball perfectly end-over-end, it will roll on a straight line. When you apply some side rotation, layouts and ball selection become much more critical. That’s why you will always see more ball motion with increased axis rotation. Revolutions only help increase hook when side roll is applied!
Post-drilling axis migration — understanding the three main paths
The direction of the migration path is related to the location and shape of the breakpoint. As you noticed in Figure 6, the three main paths can be described as:
- Upward
- Across
- Downward
Balls which have migration paths in the upward direction, more toward the fingers, will have pins closer to the VAL. This orientation produces the fastest transition (the part of the ball path known as the hook zone, and represented by a curve), the sharpest breakpoint, and yields the most entry angle. If you want this type of motion, be sure to select the short transition length in the VLS tool. It works well on certain lane conditions, but lets you know immediately when it’s time to put it back in the bag!
The 4 x 4 x 2 layout yields a migration path which goes straight across, often toward the grip center. This is a benchmark type of layout which is very popular due to its versatility. Bowlers often like balls which migrate straight across since they produce a higher amount of flare potential, without being extreme one way or the other in transition length.
Lastly, balls with migration paths that move in the downward direction, more toward the thumb, will have the longest transition length. These balls will tend to be more arcing in nature. This type of path is achieved with larger pin buffers, often with pins placed below the fingers and PSAs kicked out to or past the VAL. These layouts work better on shorter oil patterns that require more control and predictability.
People to thank
The VLS by Storm was developed with the assistance and cooperative efforts of many people, including Hank Boomershine and Victor Marion of Storm Products, Chris Forry and his entire staff at Buddies Pro Shop, Weber State University Professors Collin Inglefeld and Ronald Galli and their physics department, Don Hogue, and Mark Malinovsky.
Storm is committed to supporting competitive bowlers and pro shops worldwide. Offering emerging technologies like the Vector Layout System to the bowling world free is just one way Storm can give back to the community. I hope that you will find it to be an important tool in the decision-making process of laying out and drilling your equipment.