

Determining the most useful data to assess player performance has been a particular interest of mine for some time. Nearly a decade ago, I first published an article on evaluating a player’s performance through a thorough review of tournament data. The intent of that article was to introduce analysis concepts that provided more information than just a bowler’s average.
The article defined a power rating consisting of carry percentage and double percentage as well the use of scoring median and scoring standard deviation to more accurately determine a player’s ability. That article was a start. I believe strongly that a more thorough and meaningful analysis can be completed.
As a coach, I continually reflect on how to most accurately assess player performance and uncover the objective truth about their strengths and weaknesses realized during different phases of a tournament. This is an analysis activity that I have been doing for a long time, due to how much importance I place on the performance evaluation to inform the direction of training and future tournament preparation.
In this month’s Slowinski At Large, I attempt to make data collection and analysis more meaningful by presenting some ideas about how to find more substantive information about player tournament performance. Specifically, this article is intended to help you reflect on how to dig deeper into your performance data to uncover potential weaknesses in order to address them in your training, leading to competition improvement. The key is understanding how a player performs in different phases as well as in a specific environment.
What is meaningful performance information?
Let’s begin with an example. Imagine that you have bowled two tournaments recently. In the first tournament, you finish with games of 203, 216, 232, 199, 212, and 220. In the second event, you roll games of 228, 206, 222, 211, 195, and 217. Both are very consistent performances with an average of 213.7 for the first and 213.2 for the second event.
To be honest, averages in isolation provide very little essential information for a player to truly reveal areas of weakness especially throughout the entire tournament. To illustrate, the 195 game could have started with strikes in the first four frames or the game could have ended with four strikes. What happened within each game and when the game was bowled can provide more insight.
What about the median score? The median provides insight into the score that is in the middle of the performance (i.e., equal scores above and equal scores below). For a tournament with an odd number of games, this would be the middle score. For an even number of games, you would average the two middle scores to find the median.
In our example, the median is exactly the same at 214. I find the median value more meaningful and to provide more relative information of all of the games. To illustrate, a median that is above the average indicates that a low score skewed the average down. Conversely, a median below the average indicates that a high score skewed the average upward.
What about using standard deviation? A bowler with a lower standard deviation had a more consistent performance. A check of the standard deviation reveals that the first tournament had a standard deviation of 11.9 and the second 11.8. This didn’t provide much insight into the two performances. In essence, from an average, median, or standard deviation perspective, both tournaments were nearly identical.
Clearly, if the first was on a 10:1 house shot and the second was on the U.S. Open 1:1 pattern, the second event would be considered a significantly higher performance. This illustrates a very important concept. These two performances are relative and require more information to determine how the bowler performed and how well he executed throughout the tournament. If both performances were on sport shots, then how do you differentiate the quality of performance? More analysis with disaggregation is needed.
Understanding relativity requires us to dig deeper into data. Accordingly, the more data an individual has access to, the more likely we can accurately uncover some truths about individual player strengths and weaknesses. It isn’t just the collection of commonplace data. But, rather, the deep analysis of data and how the data is disaggregated that will reveal the most objective truth.
This process will begin with data that many readers collect on a weekly basis. This is the start. The refreshing new analysis will come with what we do with this commonly used data.
Begin by collecting meaningful data
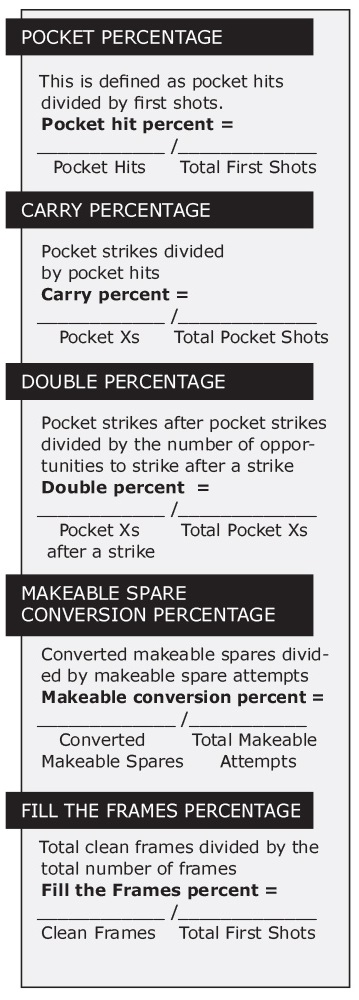
The key to allowing an effective analysis requires structuring data collection. I will begin by defining which data we want to be able to analyze. To begin, the major elements of scoring include hitting the pocket frequently, carrying when one hits the pocket, repeating shots when one is lined up, filling frames, and converting makeable spares. In order to calculate these for analysis, we will collect the following data: first shots, pocket hits, pocket strikes, makeable spares, converted makeable spares, and strikes after strikes (doubles). These data points will be used to calculate the following:
Data analysis worksheet
Structuring the data for analysis requires contextual comprehension
Now we come to the core of the matter. Structuring the data within context is how more meaning will be generated from data analysis. Many people collect the data defined above. This is neither new or earth shattering. But, few dig deep within the data to reveal trends.
To take the next steps in analysis, it is critical to not only collect the data. The critical analysis comes from determining the context of the performance data. Specifically, it is what happens within a specific environment or period of time that will be incredibly meaningful for the coach or player. For example, how often do you strike immediately following a strike? Do you match up better on the fresh or during middle to late transition? How is your performance after the pattern has 150 frames bowled on it?
A disaggregation of your performance data will reveal significantly more meaningful information. Most importantly, the disaggregation reveals objective truth which can often counter perceptions of players believing that they are very good or very bad during a specific period of play. This also will allow players to reflect on how to improve the area of weakness. Let’s begin with establishing a frame count per lane to define the transitional phase.
Transitional Phase Data
In an effort to reveal how well a bowler performs throughout an entire event, or within specific phases of the tournament, I now introduce the concept of frame count as a mechanism to determine performance in specific phases of the tournament. This information will provide insight into playing lanes properly as well as making good layout and ball choices.
To accomplish this, it is vital to define transition by first shot frame count. Just as launch angle is defined due to the 11 foot and 15 foot sensors on a lane with C.A.T.S., the frame count transitional phases will be defined to place performance within a context of first shots.
With five bowlers per lane, the approximate first shot count would approach 55 or 11 first shots per player. Accordingly, for each 55 shots per lane, this will represent a defined transitional phase.
With a defined frame count, we can disaggregate and investigate performance in each of these phases. Most importantly, with additional information, a player can identify areas of potential weakness. For example, what was your carry percentage on fresh versus early middle transition? During which transitional phase does your carry suffer the most?
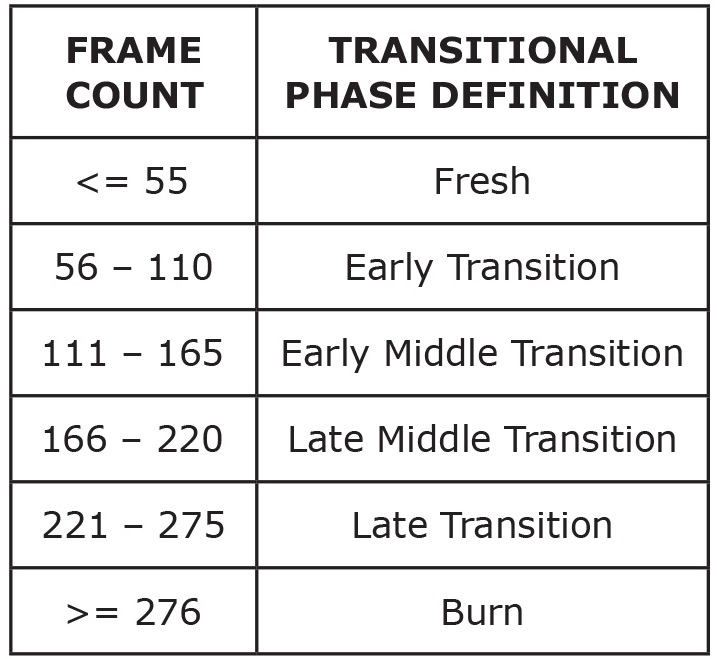
Frame count per lane vs. transitional phase
This provides deep insight and reflection opportunities. Yet, to take this to a higher level of analysis potential, we need to place the transitional data in a more specific environmental factor. Accordingly, we want to determine the performance data within each transitional phase in a specific environment. We will now dig deeper down into the data.
Additional data points
With more contextual data points, a player or coach can make a more substantive and meaningful analysis associated with each player. Accordingly, I recommend collecting the following additional information: lane surface, pattern length, pattern ratio, oil viscosity, bowling ball layout, bowling ball surface, etc. With more information, it is possible ask better questions to arrive at improved information. Consider the following example questions. How meaningful could this be for a serious bowler or team in determining strengths and weaknesses?
- What is your double percentage during the late middle transitional phase on Brunswick Pro Lane on medium patterns?
- What is your pocket percentage on fresh on long patterns when bowled on AMF HPL?
- What is your makeable conversion percentage in late transition on short patterns?
- What is your frame fill percentage on the burn on long patterns bowled on Pro Lane?
- Which layouts have been most successful for you in a specific transitional phase on short oil bowled on wood?
Over time, this depth of analysis will reveal trends that require changes to your game through training, layout choice, or a lane play plan to reach a higher level. This is only possible with the collection of more information and the follow up disaggregation and analysis of the data.
Closing remarks
With the content presented in this article, I intend to develop a database in which bowlers and coaches can utilize to conveniently engage in deep analysis of competition performance data. With an application, this rich and substantive data would provide you with excellent analysis of your performances in specific context or that of your players.
